What’s Really Driving Your Frac Performance? Insights from a Multi-Bench Montney Study
Identifying What Is Driving Distribution
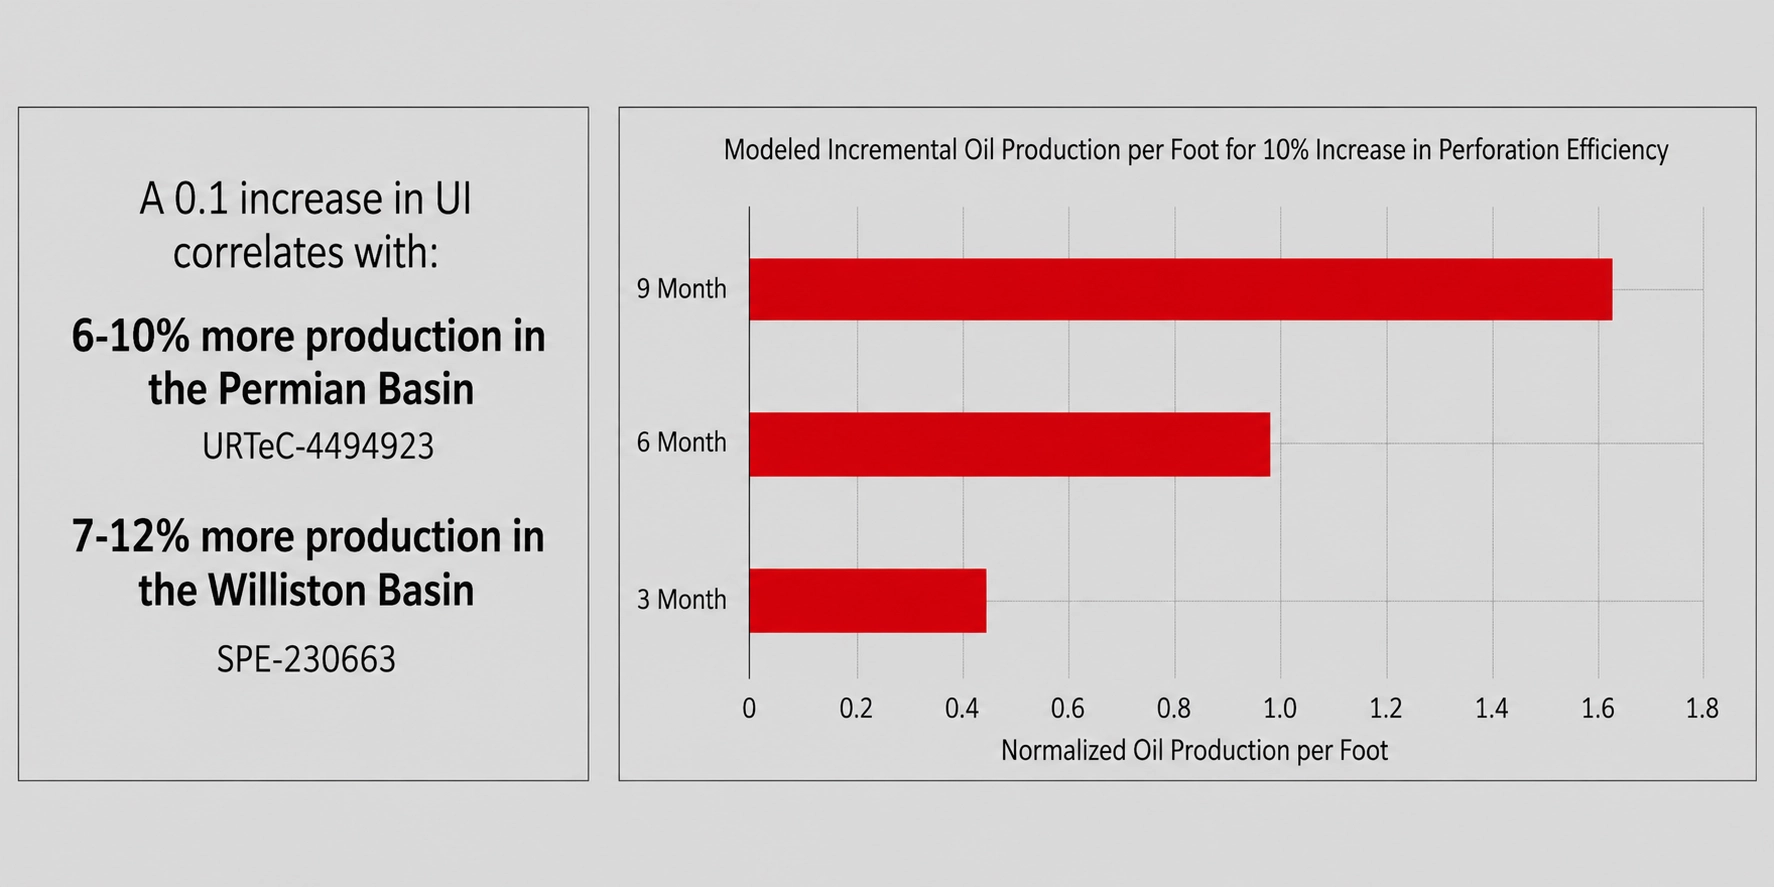
Small Changes in Uniformity Have Large Economic Impact
Field studies have shown that:
- A 0.1 increase in Uniformity Index (UI) correlates with ~6–12% more production
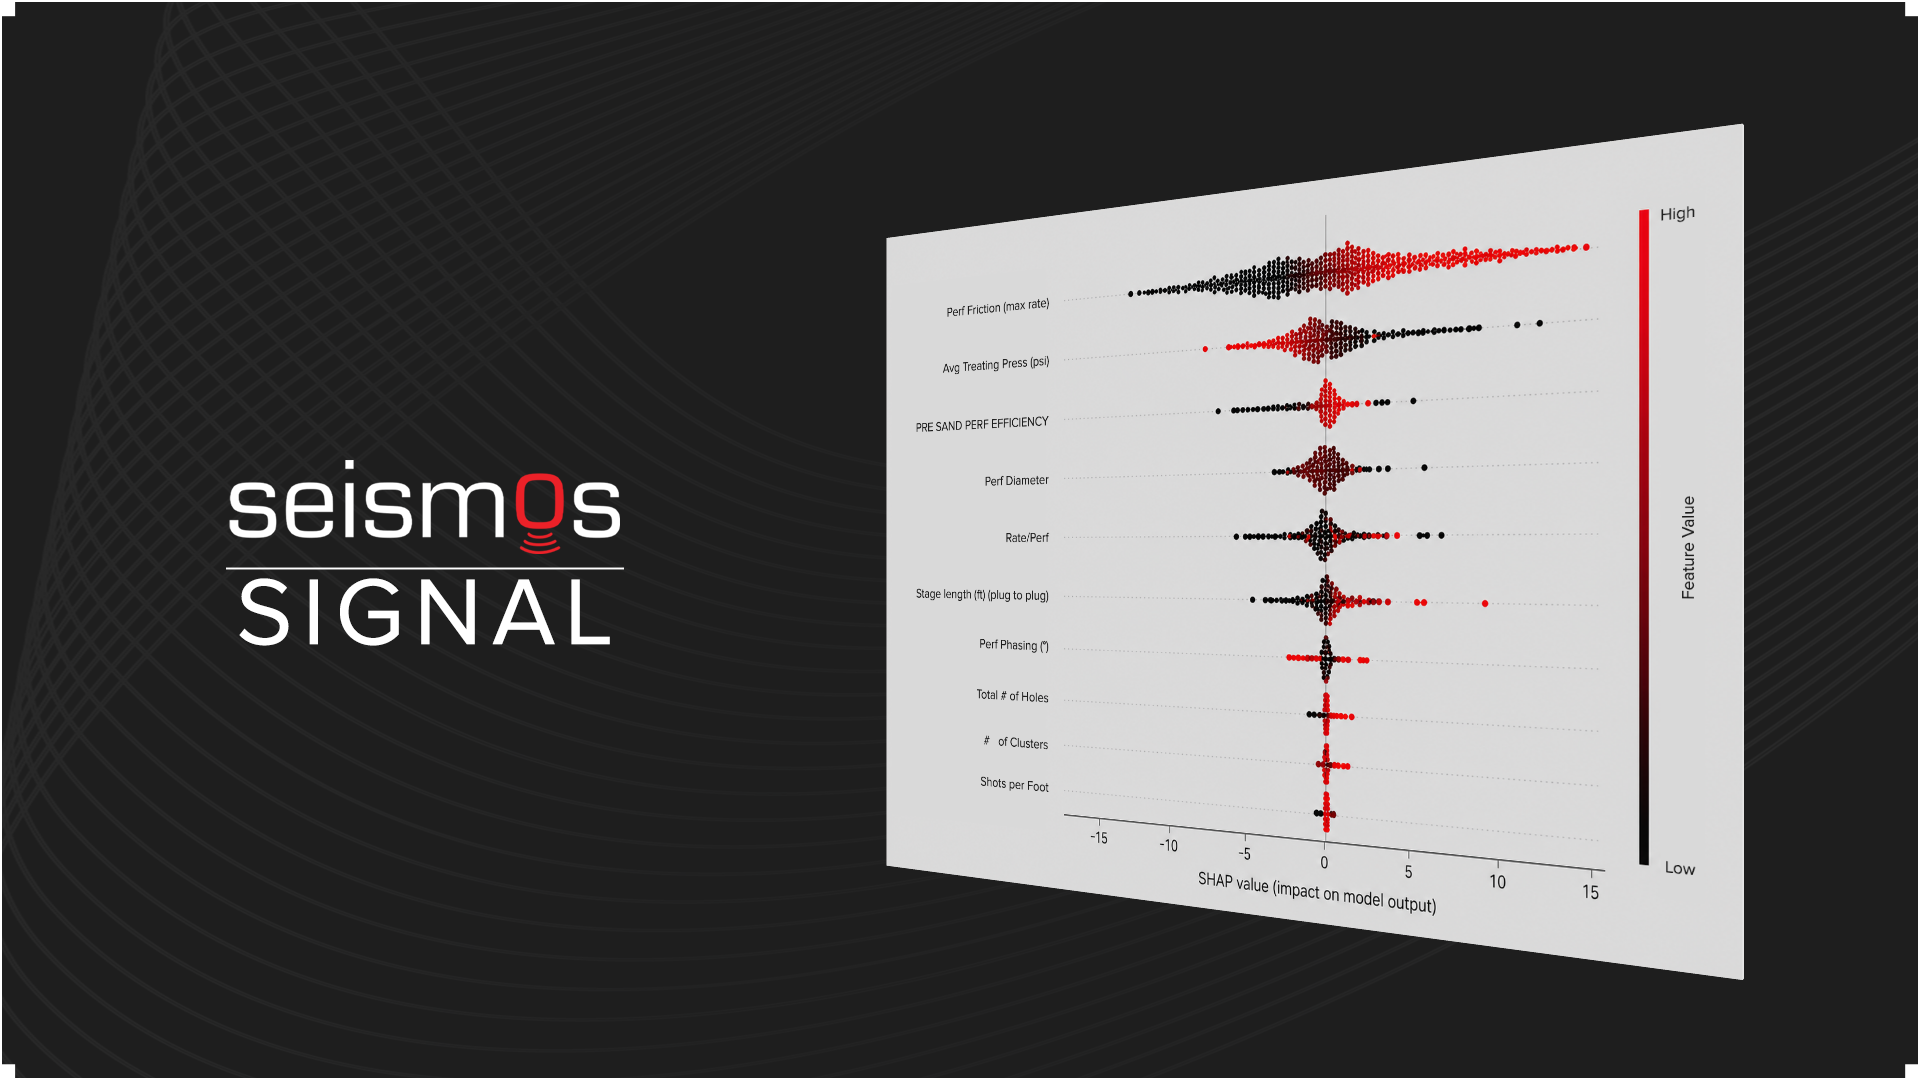
Perforation design, casing type, plug isolation, and flow velocity all influence distribution – and they interact.
Without direct measurement, these effects remain hidden.
Understanding which variables are helping – or hurting – your cluster distribution requires more than assumptions.
Direct Measurement Makes the Drivers Visible
With SAFA, operators can:
- Identify flow distribution degradation in real time
- Adjust pumping parameters during execution
- Validate design changes across wells and pads
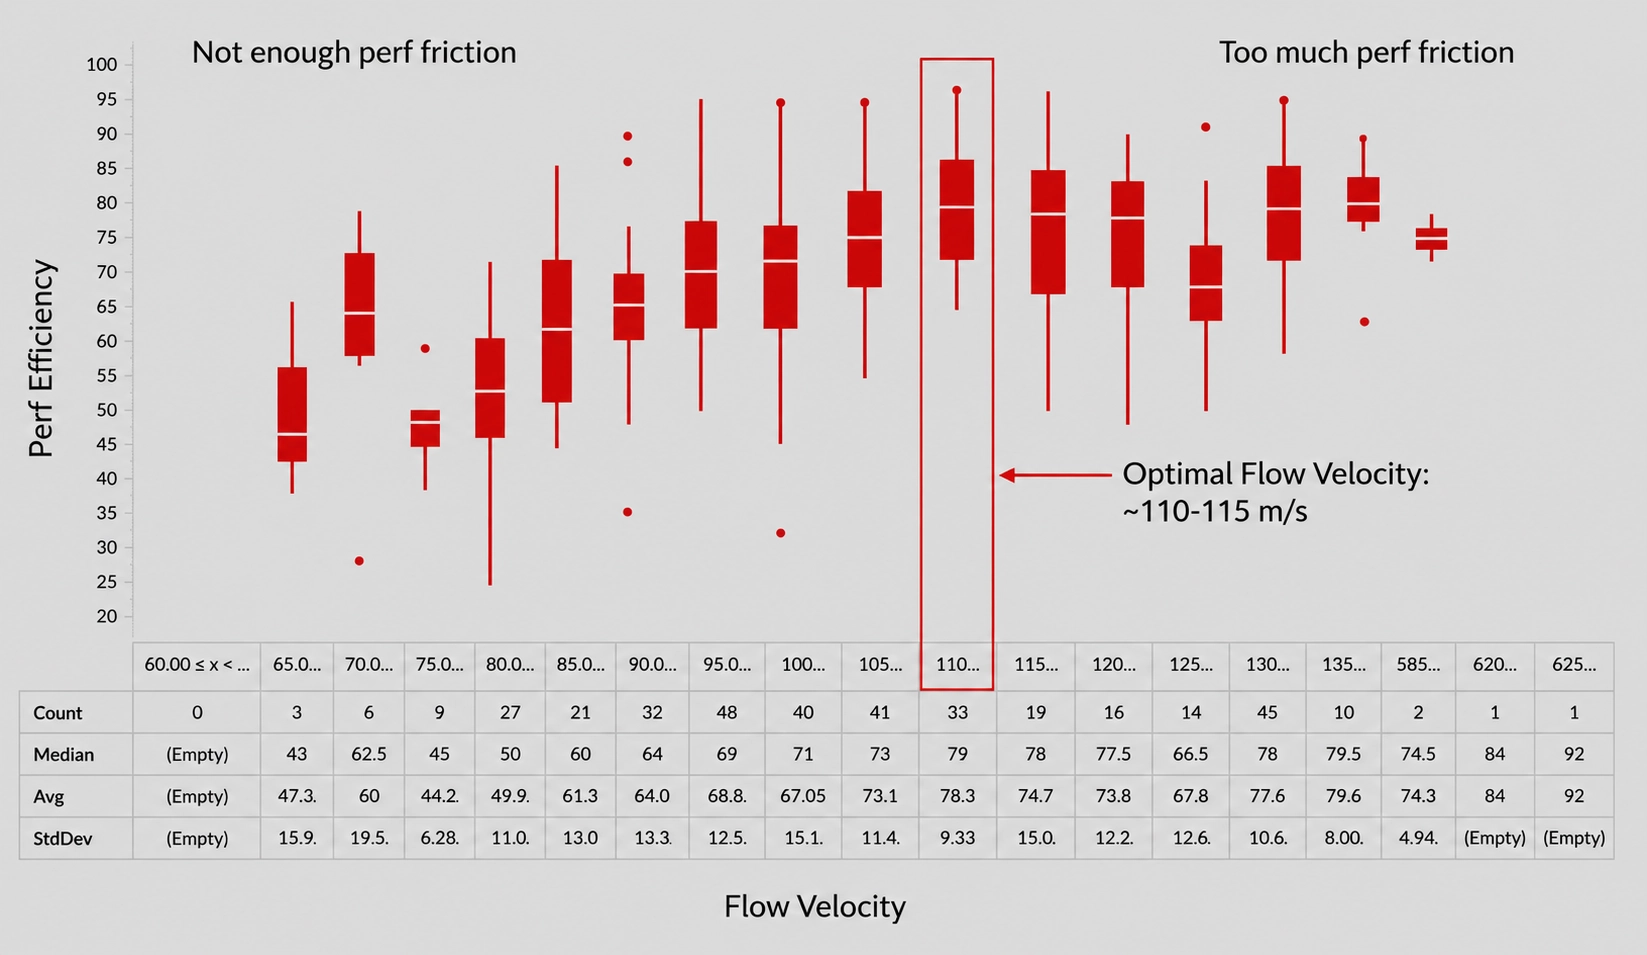
There Is a Flow Velocity “Sweet Spot”
An optimal range of 110-115 m/s emerged:
- Too much velocity increases friction
- Too little weakens limited-entry behavior
This can be adjusted through design or real-time rate control.
Results Across the 14-Well Montney Pad
Perforation Strategy Is a Key Lever
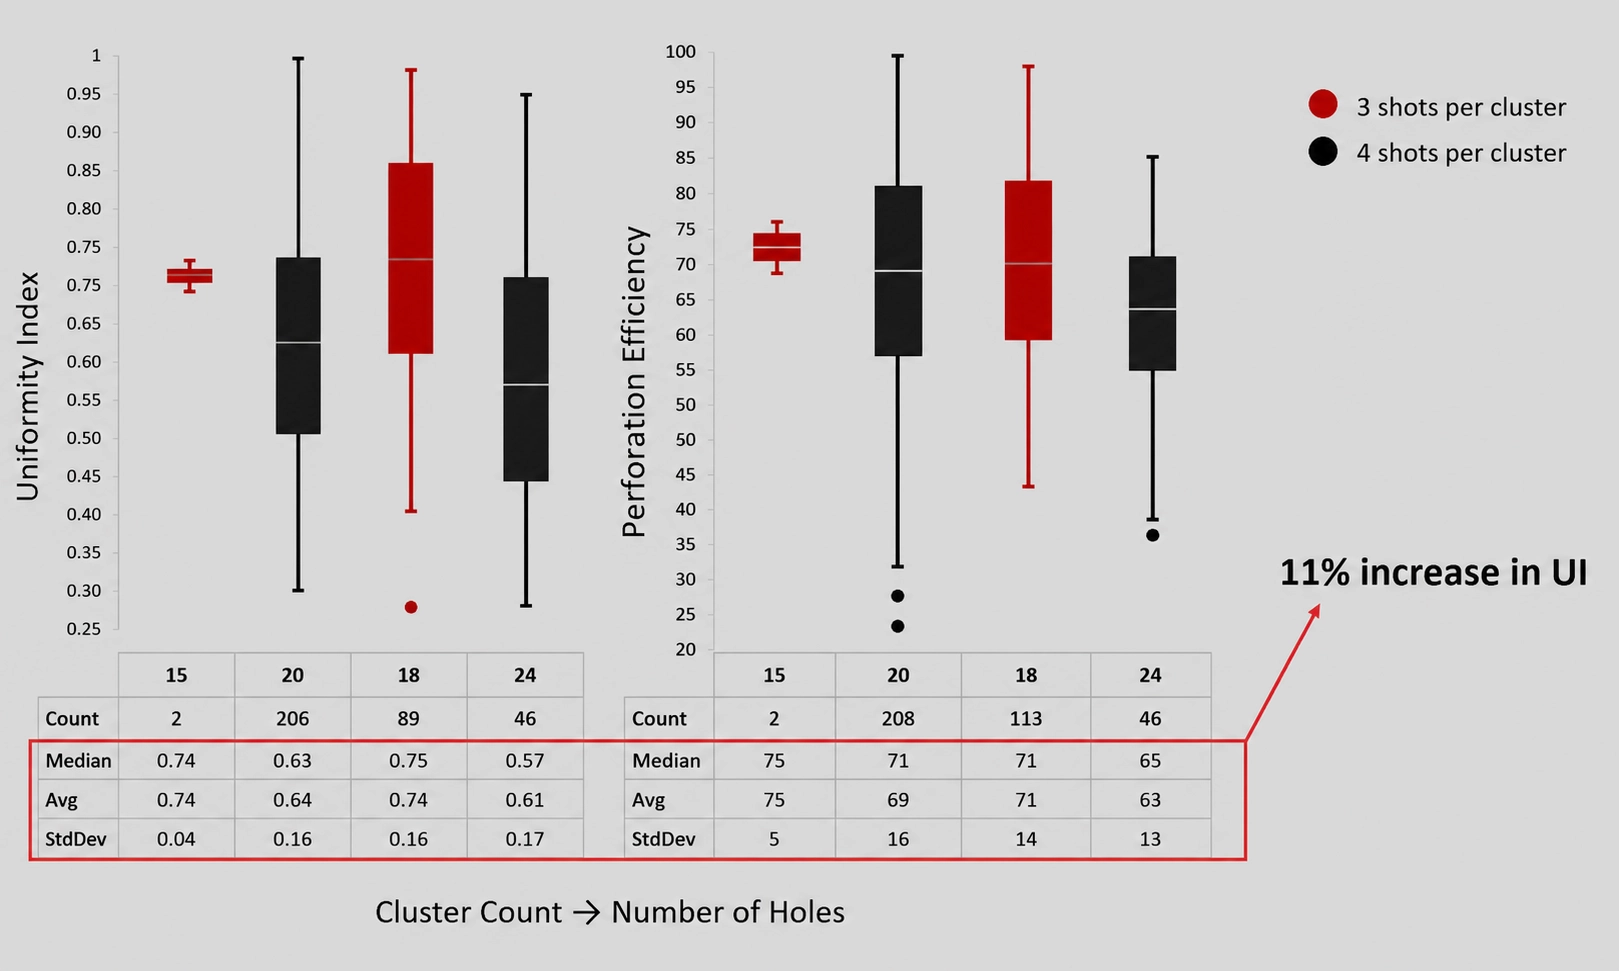
Shot density had a measurable impact:
- 3 shots per cluster → higher UI and perf efficiency compared to 4 shots per cluster
- ~11% increase in UI
Fewer holes per cluster leads to improved distribution within each cluster.
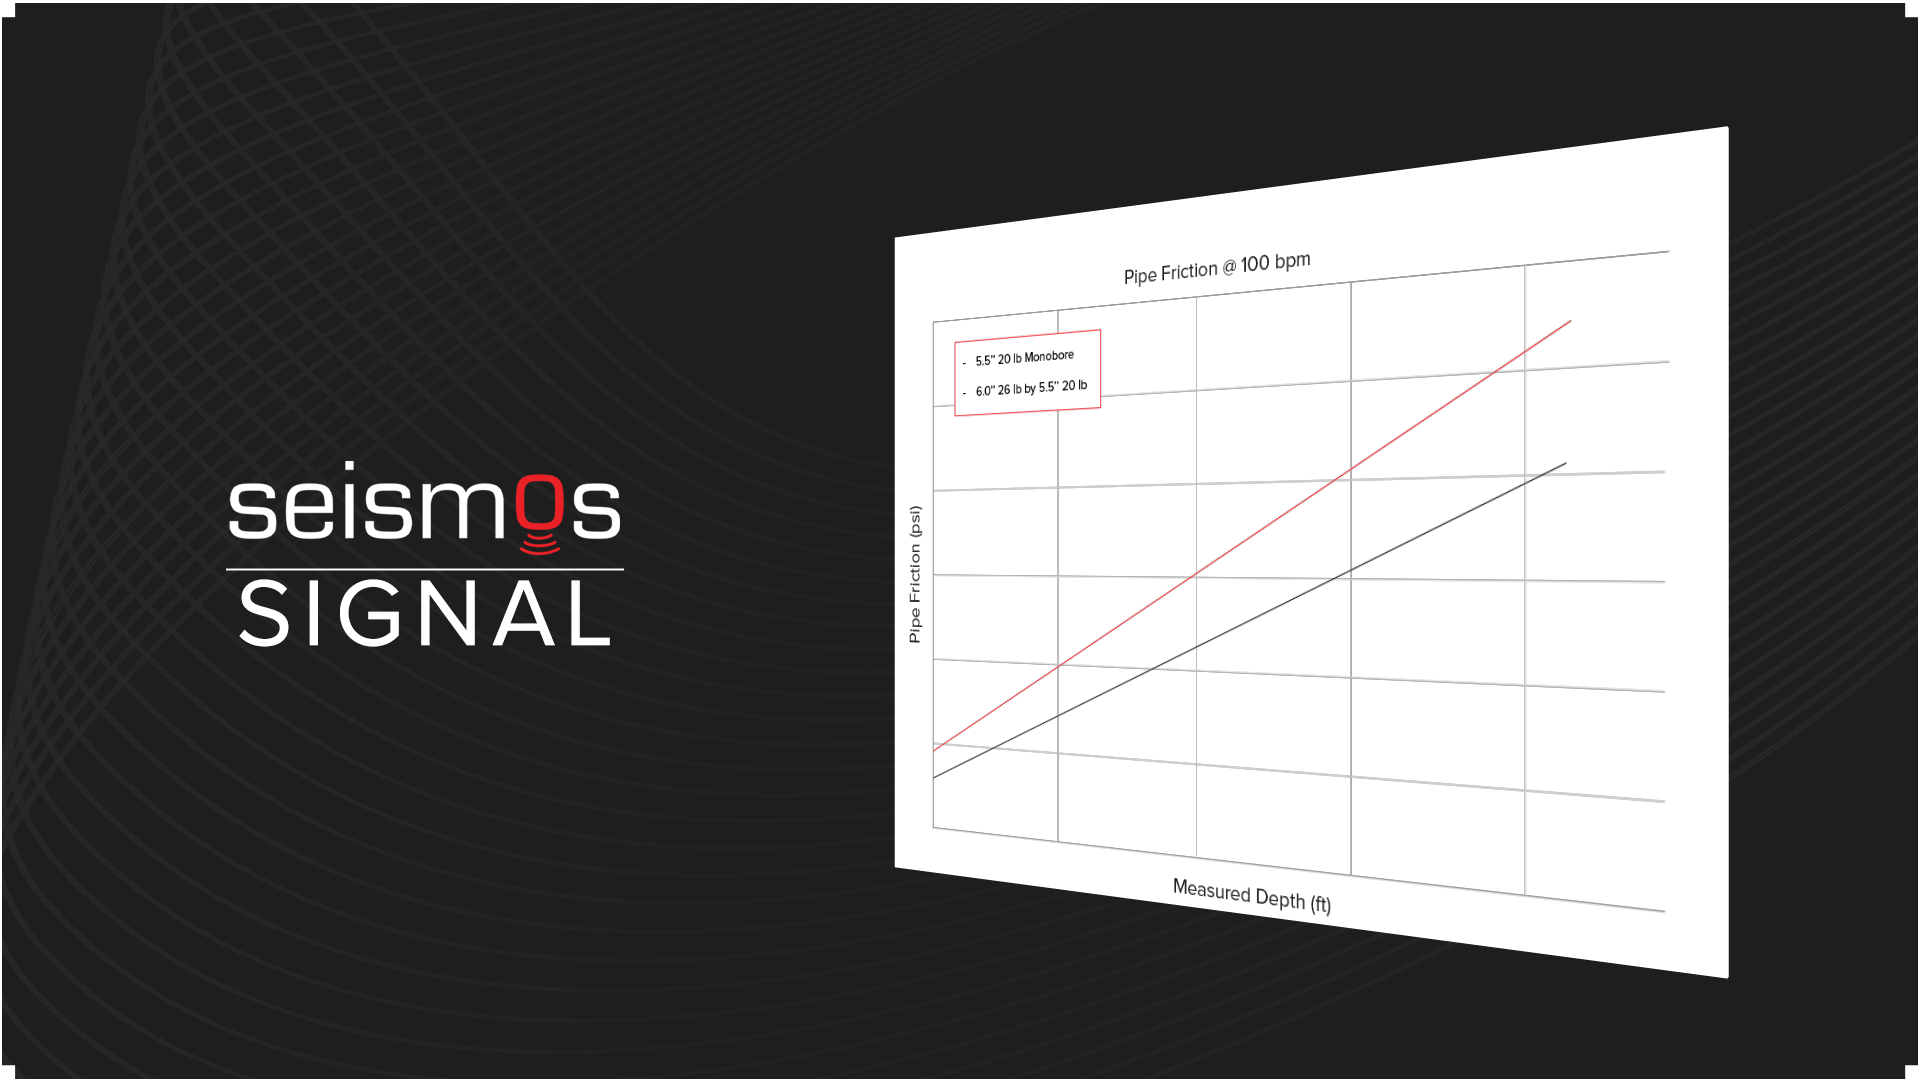
Casing Alters Perforation Behavior
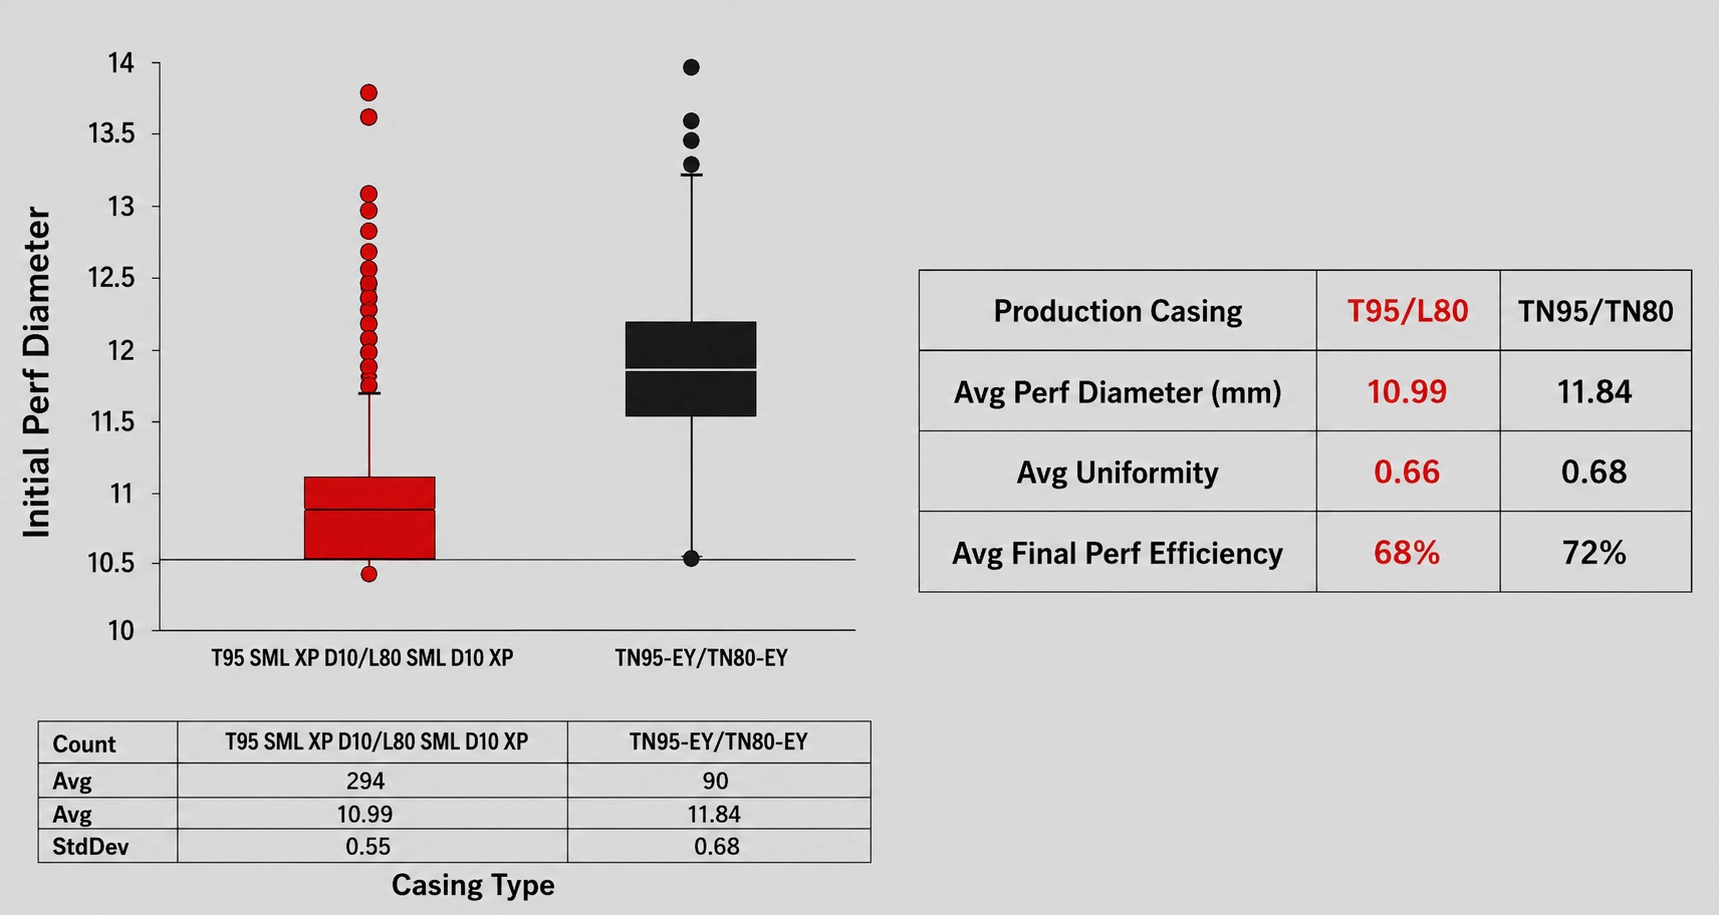
Casing metallurgy impacted effective hole size:
- L80 → smaller measured entry hole diameter than TN80
- Lower perf efficiency and UI
Casing and perforation design must be considered together.
Isolation Integrity Shows Up in Flow Area
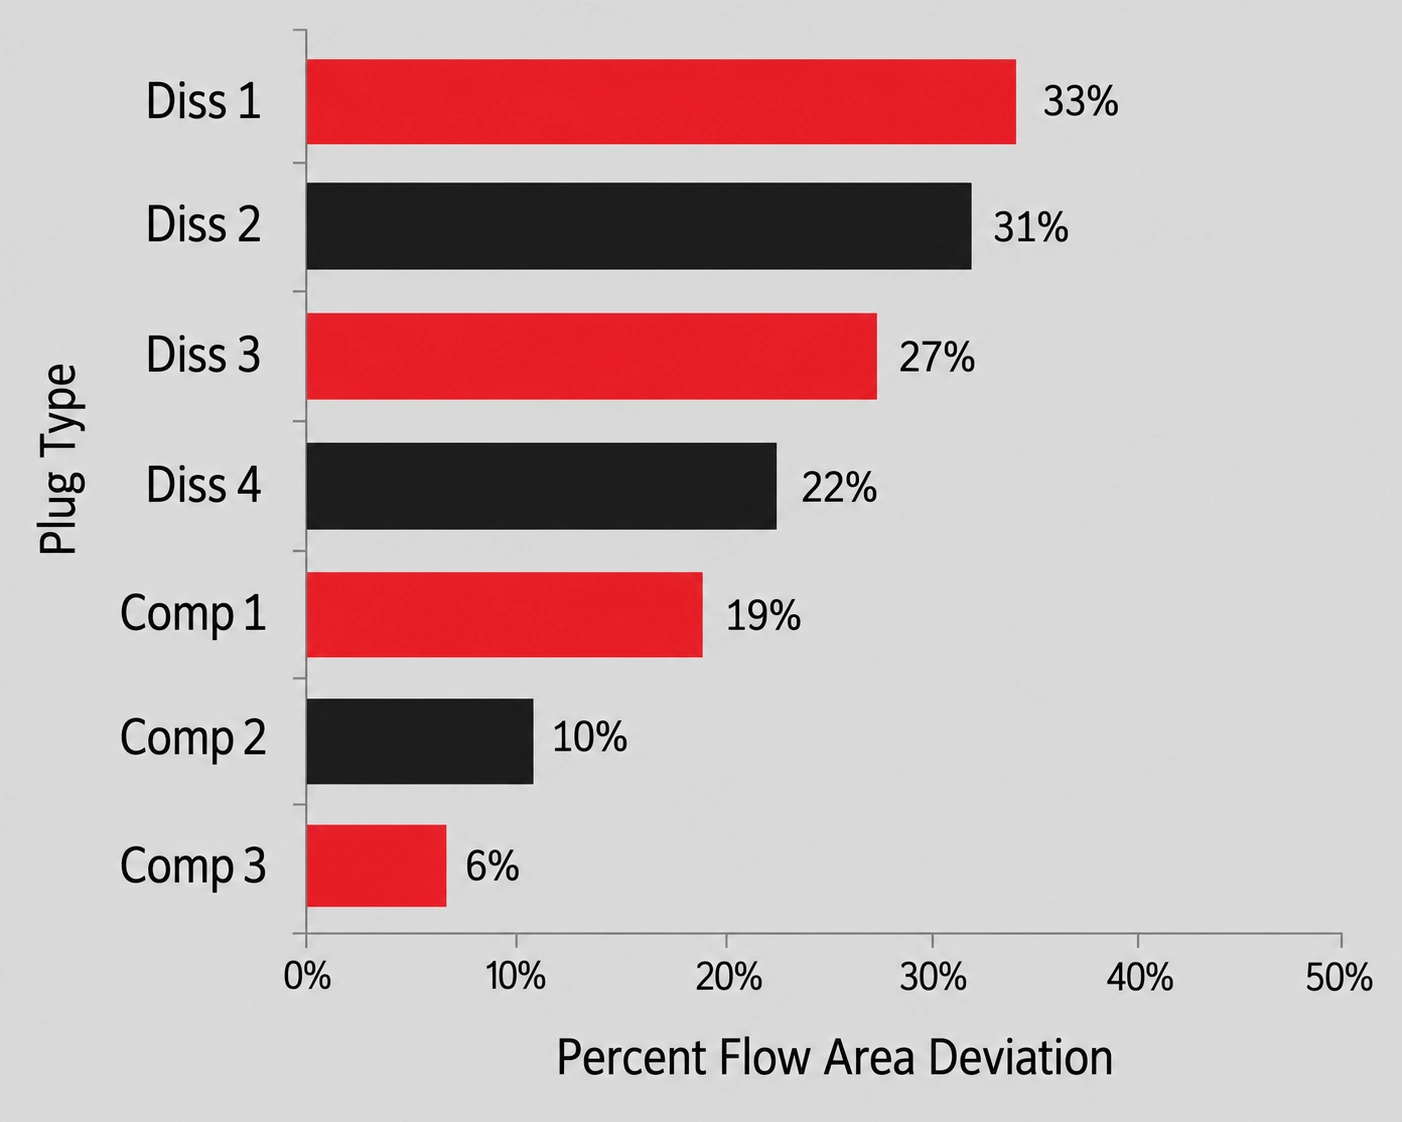
Measured flow area deviations revealed differences in plug performance by type:
- Dissolvable plugs → more indications of flow past the plug
- Composite plugs → maintained better integrity
Deviation indicates loss of zonal isolation, directly impacting distribution.
Longer Stages Without Sacrificing Distribution
Increased Cluster Count Does Not Reduce Efficiency
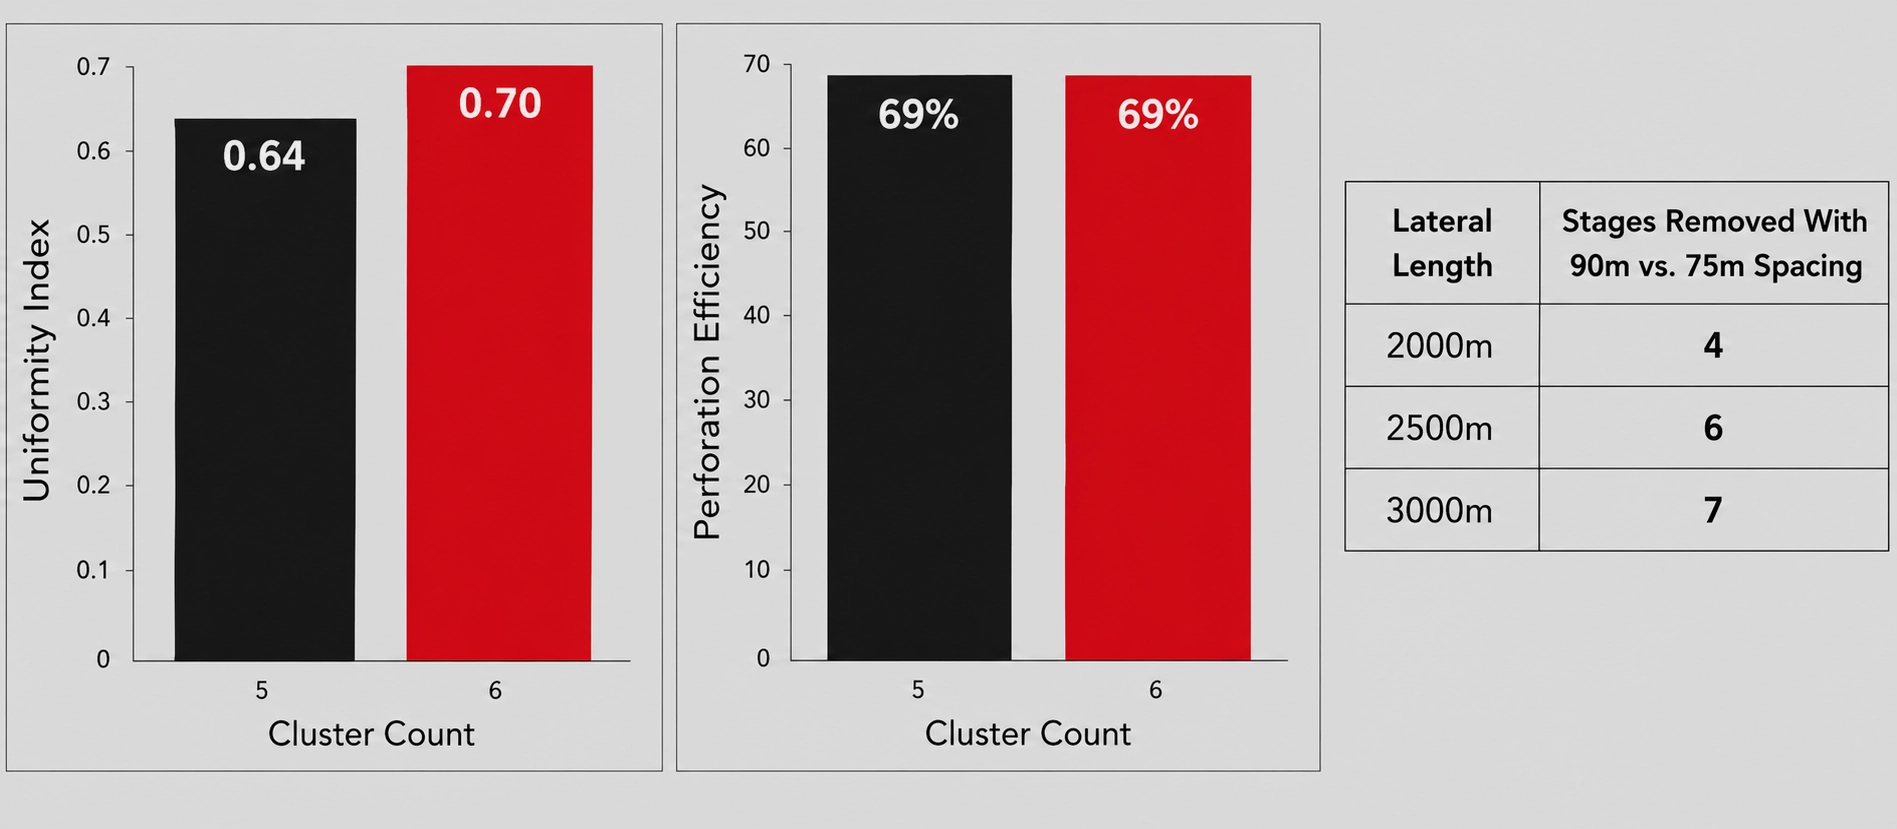
Increasing clusters did not degrade performance:
- 5 vs. 6 clusters → similar perf efficiency (~69%)
- 6 clusters → slightly higher UI
This enables longer stages and fewer total stages, reducing overall cost without sacrificing fluid distribution.
That makes cluster distribution one of the highest-leverage variables in completions.