Perforation Efficiency is a Production Metric
- A 10% increase in well-average perforation efficiency corresponded to approximately +1,600 bbl per 1,000 ft of additional 9-month oil production.
- That uplift represented an 11% increase in production relative to the average well in the study population.
- The relationship strengthened over time, with perforation efficiency p-values improving from 0.27 at 3 months to 0.10 at 6 months and 0.03 at 9 months.
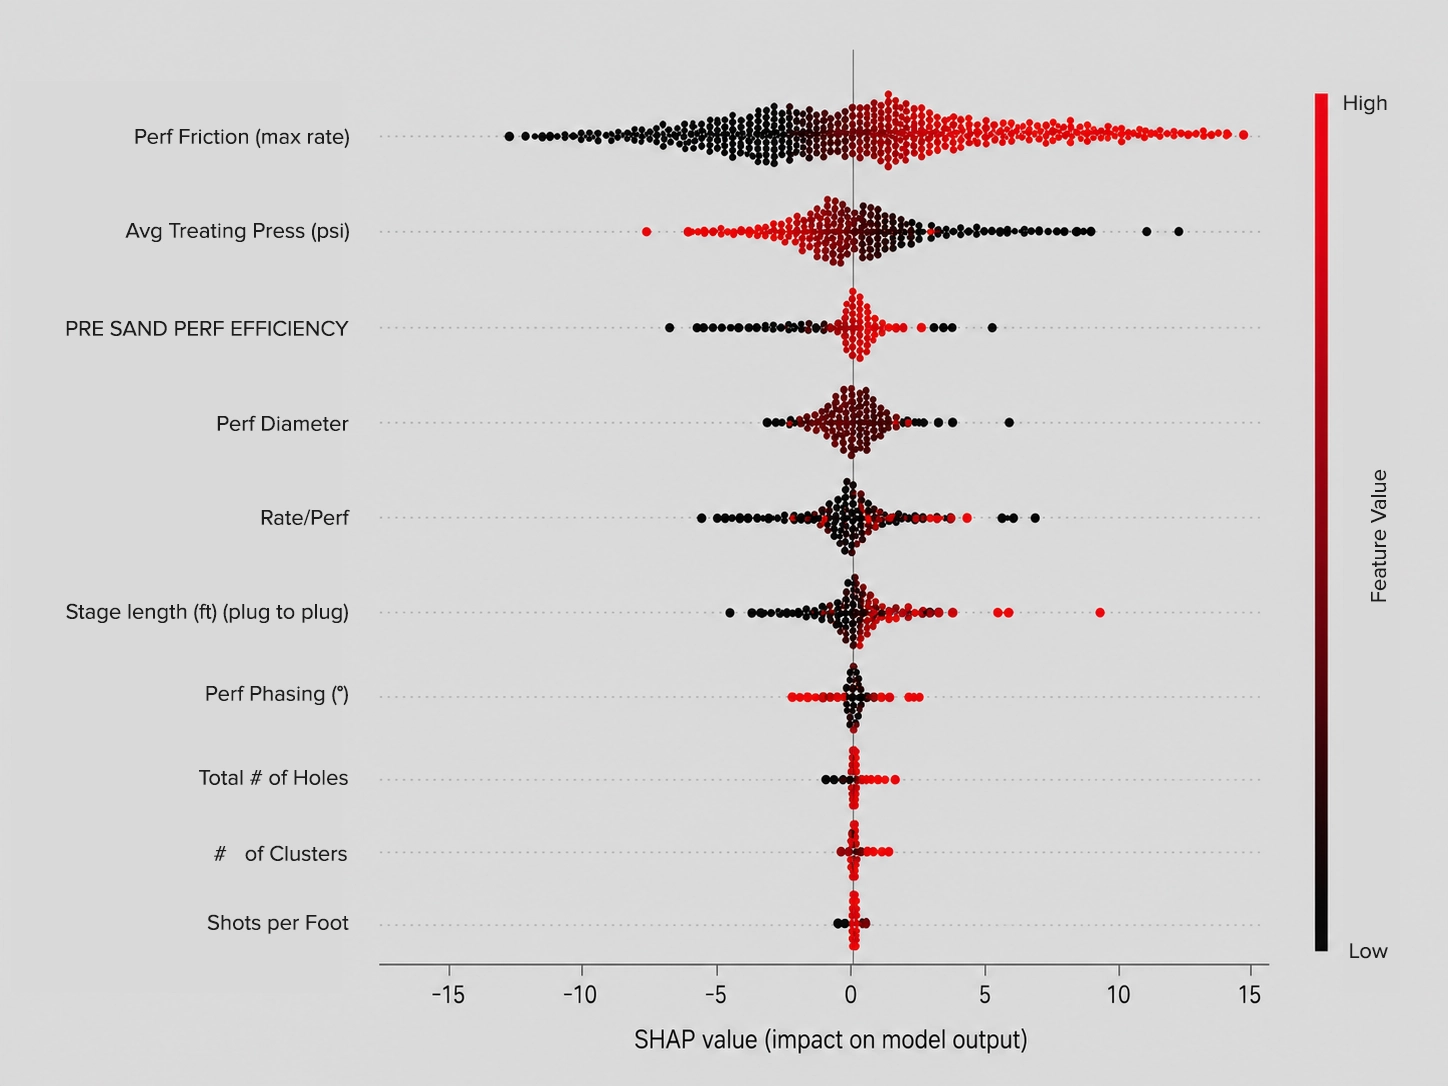
- Designed perforation friction at maximum rate was the strongest completion design driver associated with higher predicted perforation efficiency.

Turning Pressure into a Stage Quality Metric
Seismos Acoustic Friction Analysis uses high-frequency surface pressure data from controlled or naturally occurring rate changes to decompose the pressure response into pipe friction and perforation friction.
By comparing pre-sand and post-sand friction behavior, the workflow calculates initial equivalent hole diameter, effective perforation flow area, and end-of-stage perforation efficiency.
In this study, stage-level perforation efficiency showed a wide range of behavior, while well-average perforation efficiency was more tightly clustered, with most wells falling between approximately 65% and 75%.
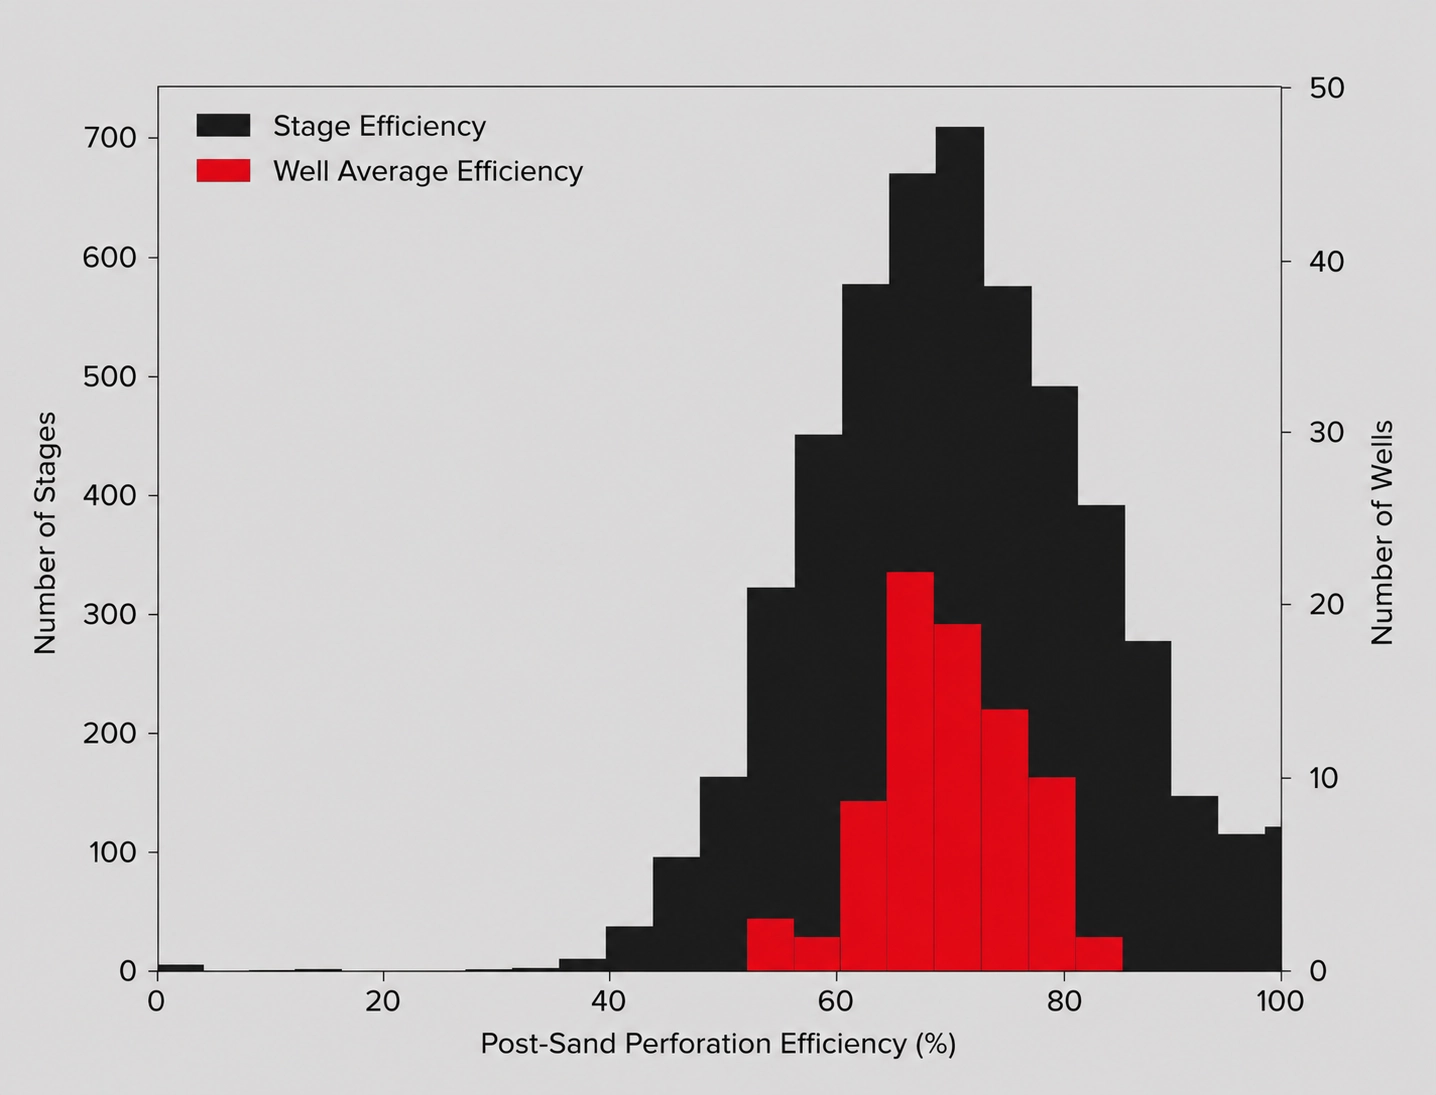
That distinction matters. Stage-level efficiency captures the variability occurring during individual treatments, while well-average efficiency provides a more stable metric that can be compared against well-level production.
Higher perforation efficiency means more perforations are effectively contributing to flow. Lower perforation efficiency indicates fewer perforations are taking fluid, reducing limited-entry effectiveness and increasing the likelihood of non-uniform stimulation.
Midland Basin Data Shows the Signal
Approximately 200 Midland Basin wells were monitored for Diamondback using acoustic friction analysis as part of routine completion diagnostics. From that broader population, 85 wells were selected for production regression based on data completeness, geographic consistency, usable pre- and post-sand rate drops, and public production data.
The wells were grouped by formation and development area to account for reservoir and spatial variability. Formation and local area remained the dominant contributors to production differences, as expected.
Even after controlling for those effects, perforation efficiency showed an independent relationship with normalized oil production.
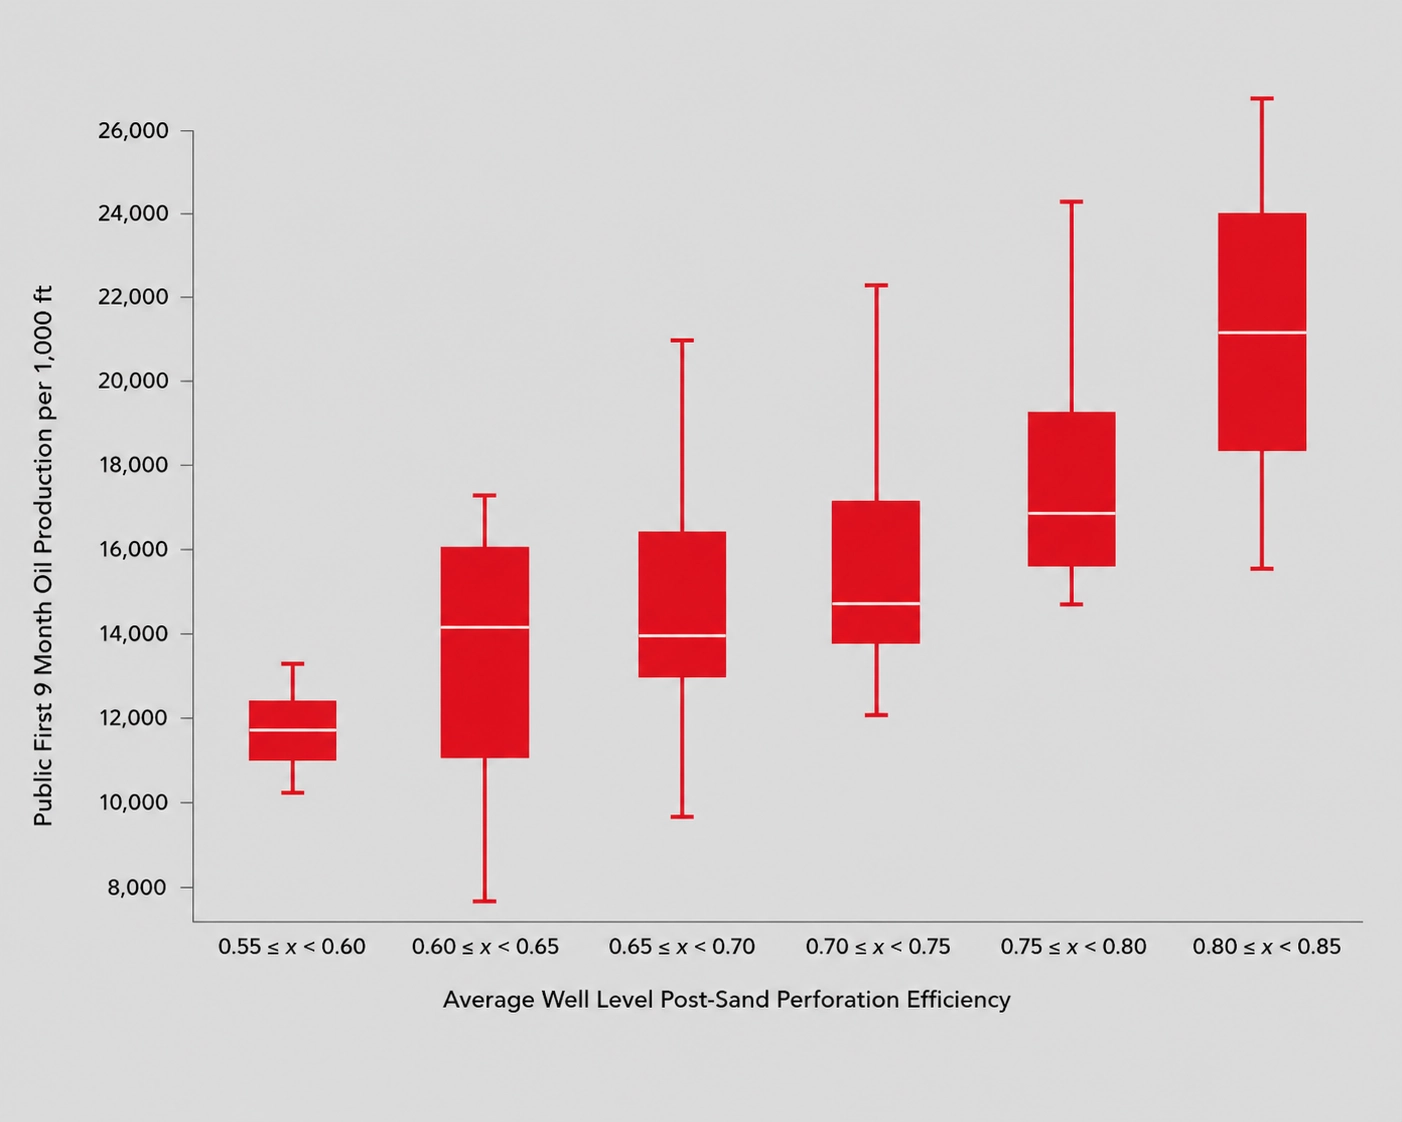
The relationship became stronger as cumulative production increased. Perforation efficiency p-values improved from 0.27 at 3 months to 0.10 at 6 months and 0.03 at 9 months. In simple terms, lower p-values indicate stronger statistical support, and by 9 months perforation efficiency was a statistically significant predictor of production performance.
After 9 months of production, a 10% increase in well-average perforation efficiency corresponded to approximately +1,600 bbl per 1,000 ft of lateral in additional normalized oil production.
For a 10,000-ft lateral, that equates to approximately +16,000 bbl of incremental oil over the first 9 months.
Completion Quality Creates a Production Lever
The most important takeaway is that perforation efficiency is not just a diagnostic output.
It is tied to production.
For this dataset, a 10% increase in perforation efficiency corresponded to roughly an 11% increase in 9-month oil production relative to the average well.
The study also found that major treatment-scale variables, including fluid intensity and proppant intensity, did not materially improve 9-month production within this dataset. Treatment scale was relatively consistent across the wells.
Instead, the measured quality of near-wellbore fluid distribution mattered more than how much fluid or proppant was pumped.
To identify which design and execution parameters mattered most, the study used SHAP analysis, a model-interpretation method that ranks which inputs have the strongest influence on a prediction. Across 8,143 stages, designed perforation friction at maximum rate was the strongest driver associated with higher predicted perforation efficiency, reinforcing the role of properly designed limited-entry perforating in improving fluid distribution.