What’s Hiding in Your Treating Pressure? How SAFA Separates Pipe and Perf Friction
- Accurate pipe friction measurement sets the baseline for perf friction, perf efficiency, and UI calculations. Any error in this input propagates through the entire workflow.
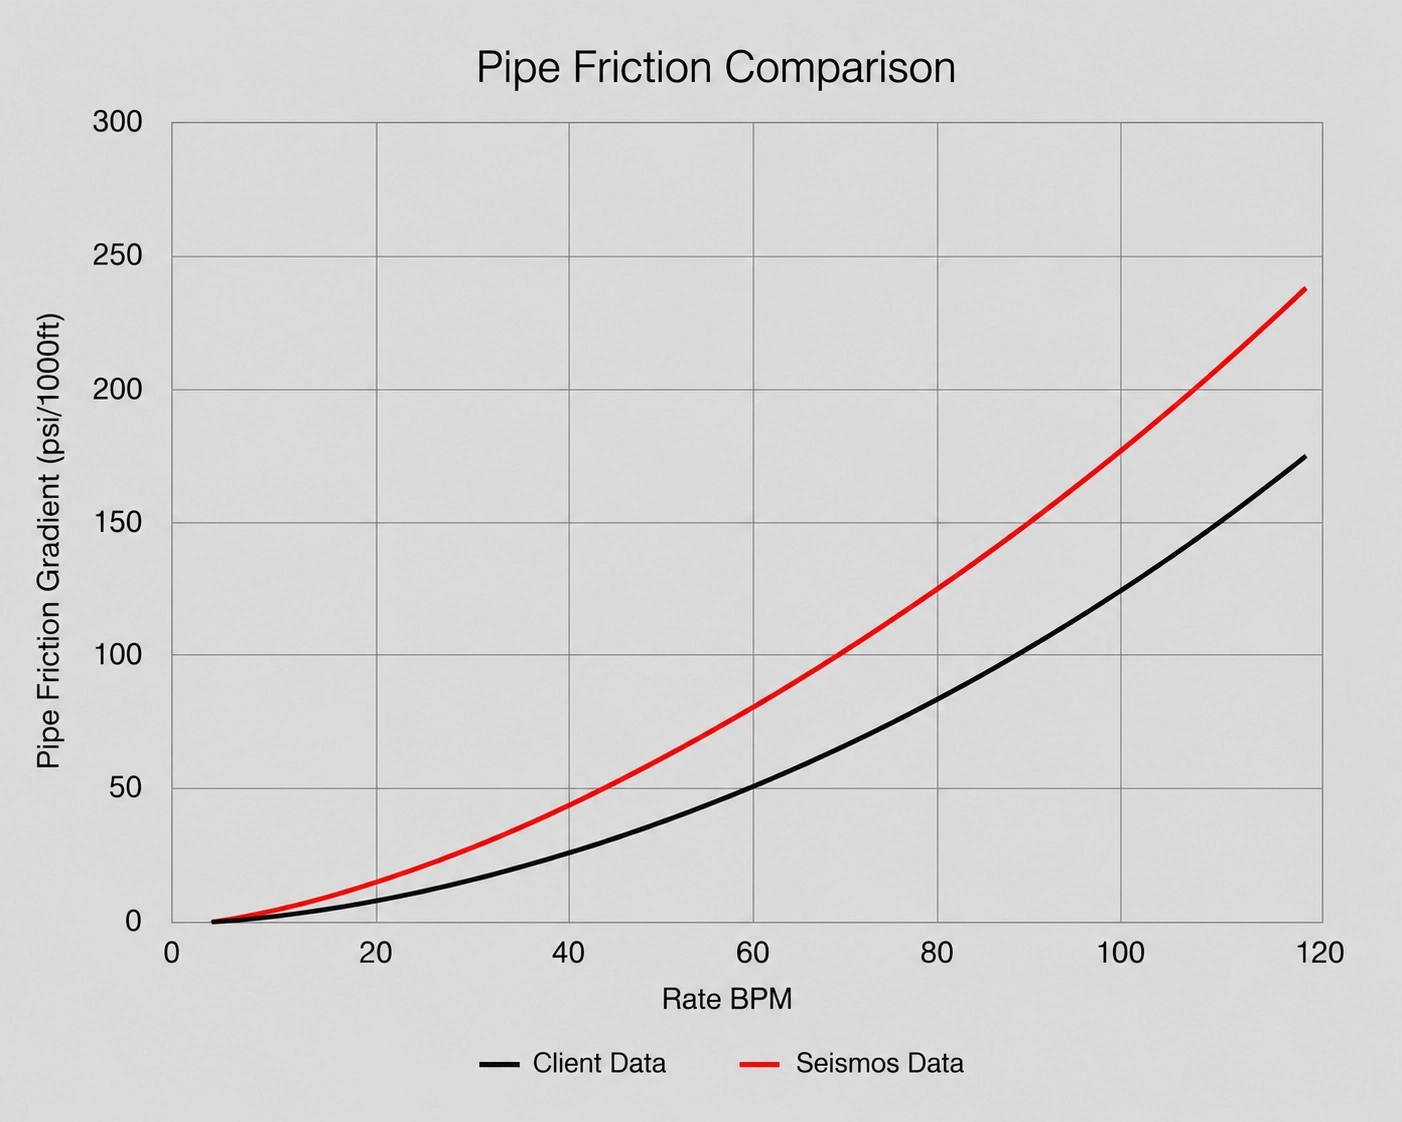
- Spec sheet or flow loop modeled friction curves routinely under- or over-estimate true friction at treating rates, masking or exaggerating perforation behavior.
- SAFA’s direct friction measurements remove this ambiguity, allowing perforation and near-wellbore behavior to be correctly interpreted.
- SAFA provides reliable real-time information using only surface pressure data – exposing what conventional treating pressure measurements cannot.
Why Understanding Friction Matters for Real-Time Perf Efficiency
In step-down tests, pipe friction is assumed rather than directly measured, which can introduce a significant source of error into perforation efficiency calculations.
Step-down tests are mathematically non-unique. This inability to decouple pipe friction from perforation friction means several friction combinations can match the same pressure response. The chart below highlights a systematic 200-400 psi overestimation of pipe friction when using traditional step-down test methods.
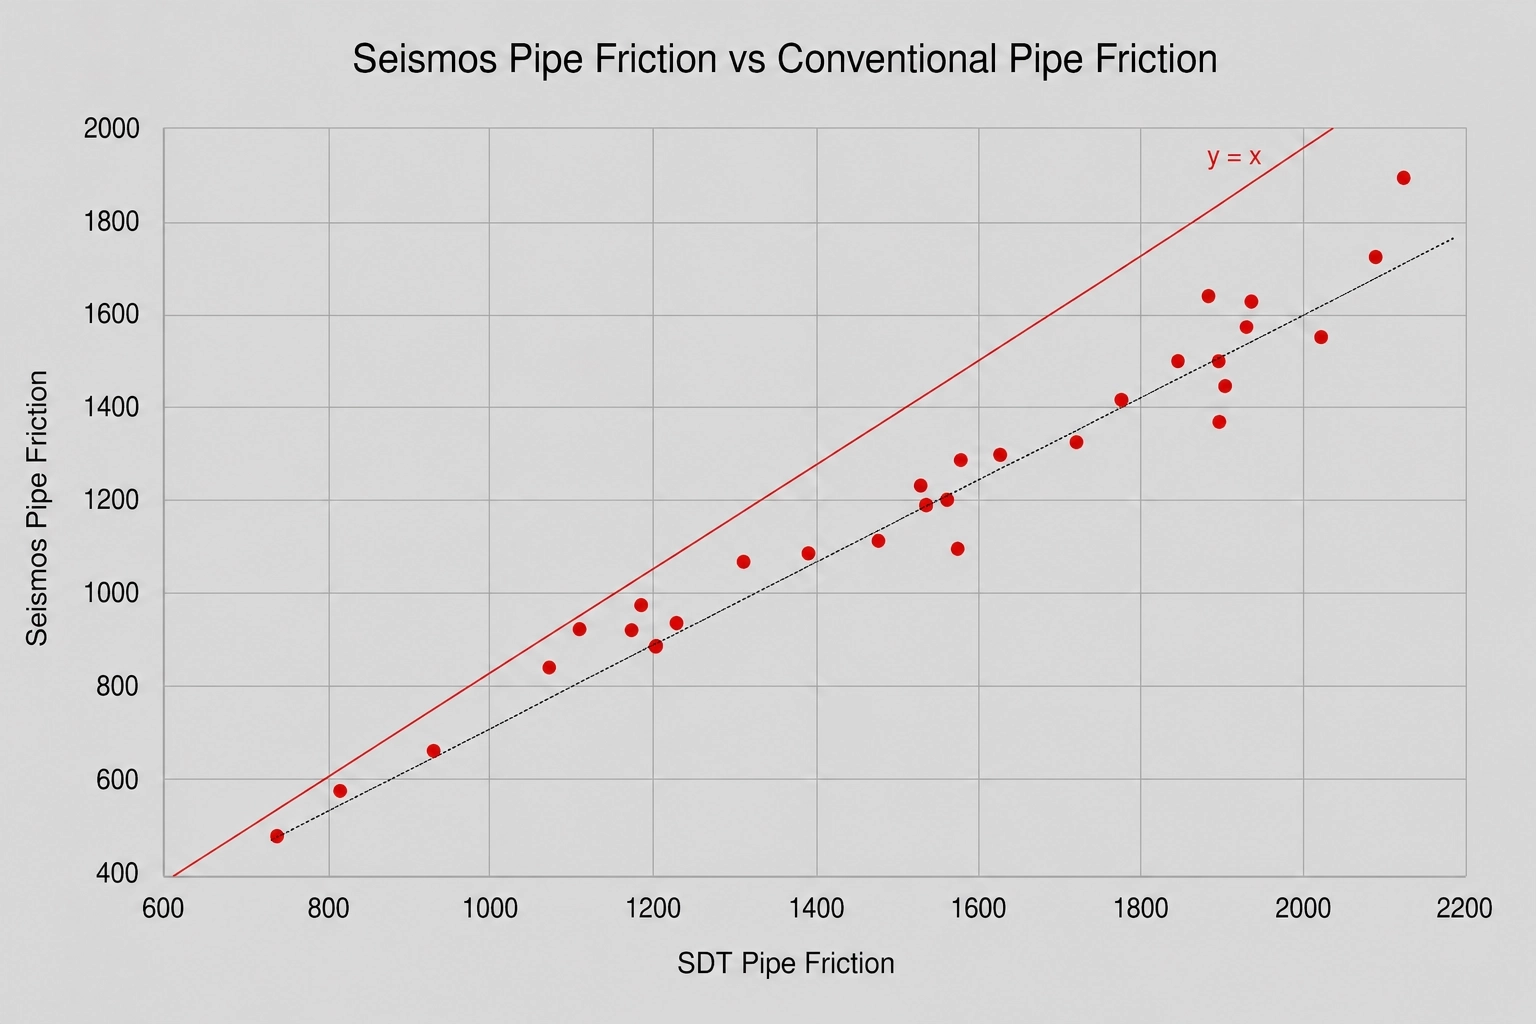
When pipe friction is overestimated, the remaining pressure is incorrectly assigned to the perforations, inflating calculated perf efficiency and creating a false sense of healthy distribution while meaningful losses are occurring downhole.
Direct Friction Measurement Removes the Ambiguity
Direct acoustic friction measurements remove this ambiguity, enabling engineers to make decisions based on actual near-wellbore behavior, rather than model-driven friction error.
- Trustworthy Diagnostics: Accurate pipe friction makes treating pressure more reliable, ensuring perf friction, perf efficiency, and UI trends reflect true downhole conditions rather than lab-based input errors.
- Early Anomaly Detection: A correct friction baseline exposes deviations hidden in treating pressure, allowing erosion, plugging, or isolation issues to be identified and addressed sooner.
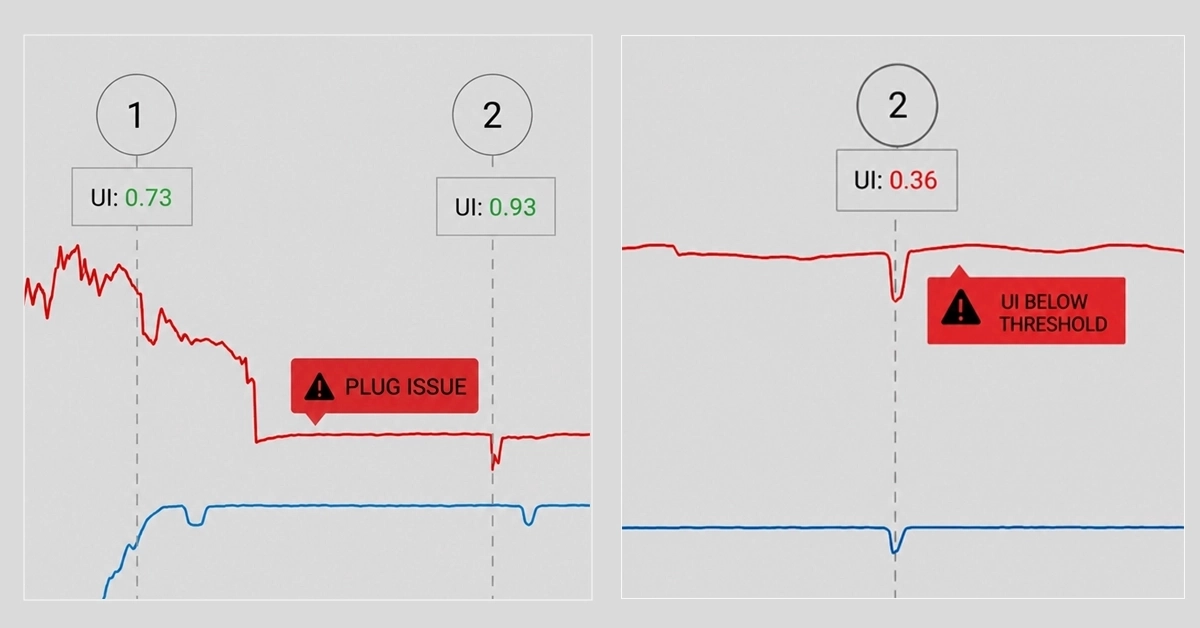
Real-Time, Scalable Optimization: SAFA’s high-speed surface pressure data enables live stage monitoring and on-the-fly optimization of distribution and limited-entry performance. With no operational changes required, it can be deployed across entire fields for consistent frac QC.
Operational Consequences During Fracturing
Incorrect pipe friction assumptions have direct - and often costly - impacts on real-time decision making.
When step-down tests or spec sheet friction curves misrepresent wellbore friction, treating pressure cannot be accurately separated into pipe and perforation components, causing more or less of the total friction to be incorrectly attributed to the perforations.

Suppressing calculated perf efficiency can make a well-behaving limited entry design appear to be degrading, prompting unnecessary rate cuts, proppant reductions, or premature fluid reallocation.
Conversely, stages with genuine distribution issues may appear normal because the incorrect pipe friction is masking the real response.
Overall, overconfidence in treating pressure diagnostics leads to inconsistent operational behavior and inconsistent and suboptimal well performance.