Taking Charge of a Controllable Variable: Is your perforating gun costing you?
Is Your Perforating Gun Costing You?
The perforating charge you run has a measurable impact on perforation efficiency and cluster uniformity – even when the rest of the completion design stays the same.
Across six charge designs evaluated in this study, the charges that deviated the most from their specified perforation diameter also produced the weakest stimulation metrics.
Meanwhile, charges that tracked closer to their specified perforation diameter consistently delivered stronger stimulation performance.
• Across six charge designs evaluated in this study, the charges that deviated the most from their specified perforation diameter also produced the weakest stimulation metrics.
• Meanwhile, charges that tracked closer to their specified perforation diameter consistently delivered stronger stimulation performance.
• Charges B and C averaged only 63% and 56% perforation efficiency, with corresponding UI values of 0.68 and 0.61 – the lowest across all charges evaluated.
• By comparison, charge F delivered 77% perforation efficiency and a UI of 0.84, indicating significantly stronger cluster contribution and stage distribution.
Not Every Charge Is Created Equal
In other words, not every charge will behave the same in the well – even if the spec sheet suggests it should.
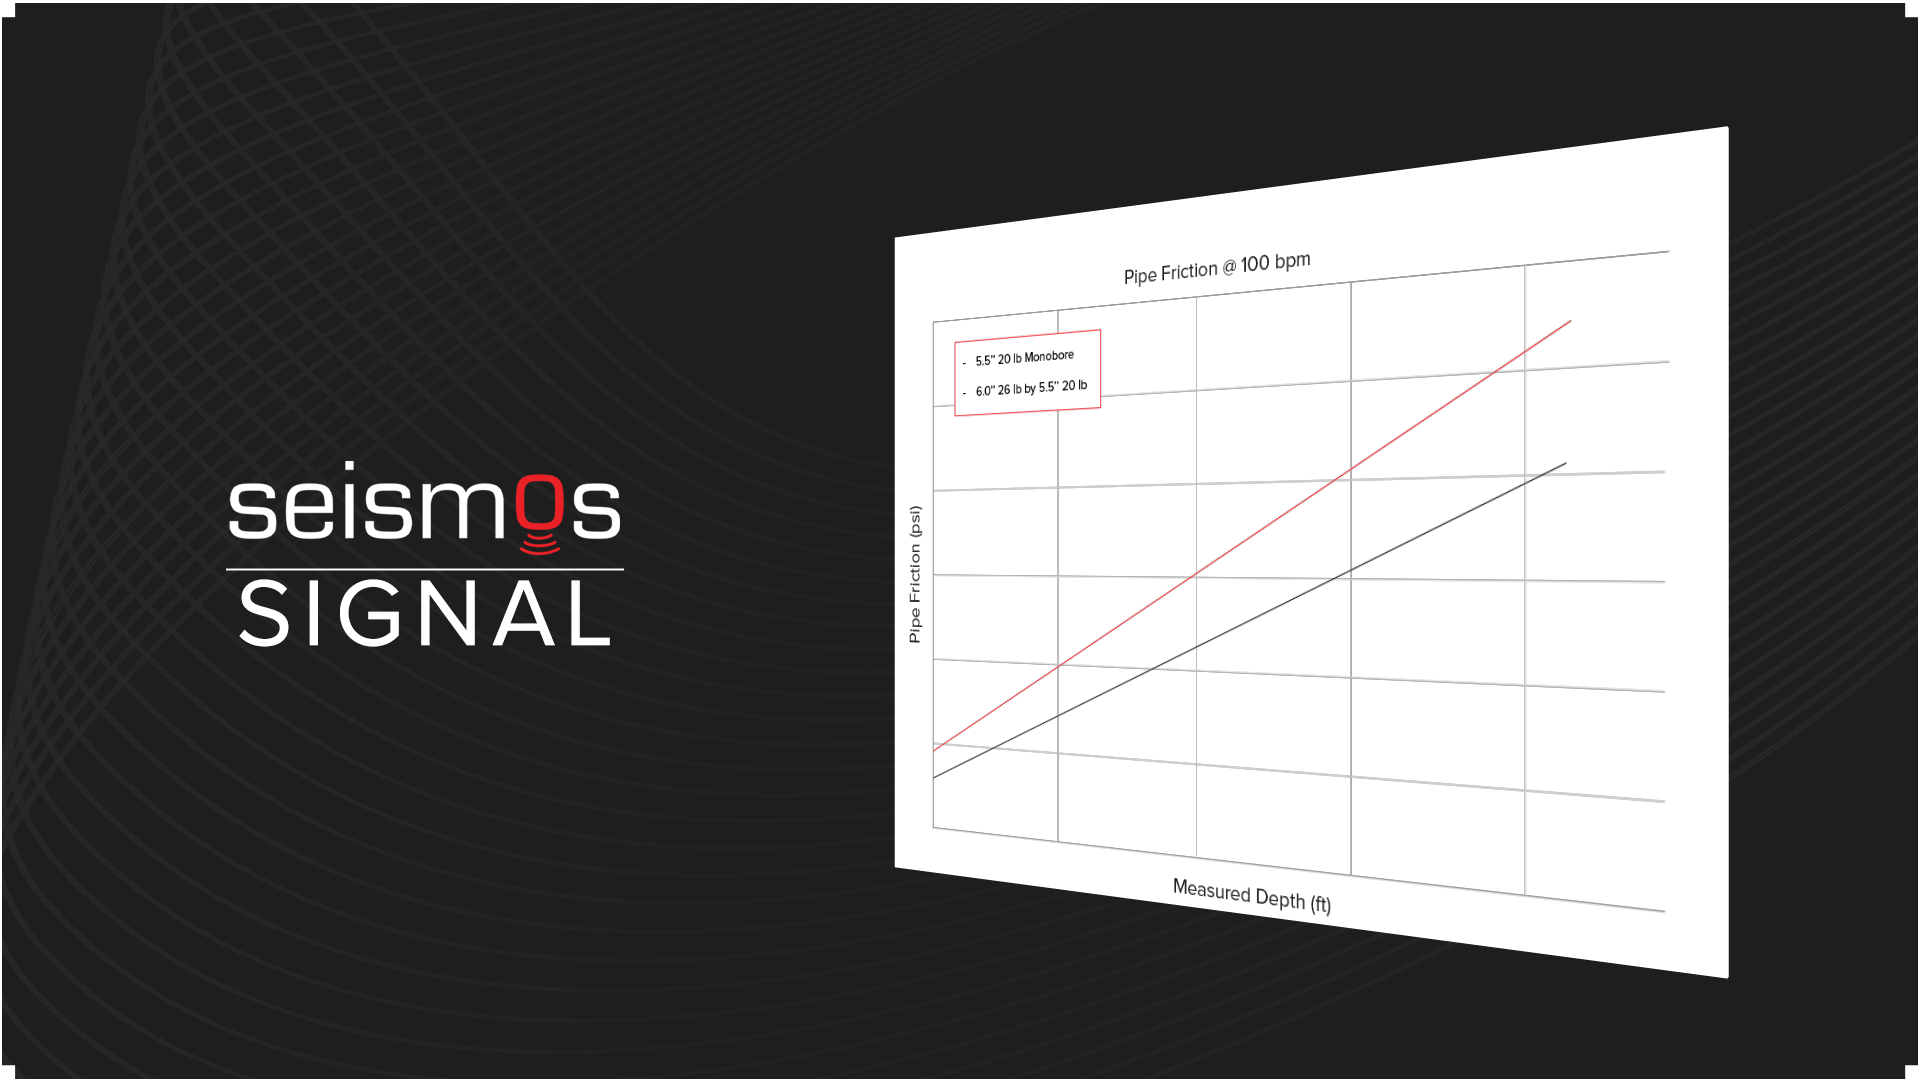
Modern completions rely on limited-entry perforating, where controlled perforation friction creates the pressure drop needed to distribute slurry evenly across clusters.
Hole size is therefore a critical design parameter: larger perforation holes reduce perforation friction, while smaller holes increase it, helping maintain the pressure differential required for uniform cluster contribution.
The Smarter First Move in Completion Optimization
In this study, gun carrier, string configuration, orientation, and stage design were held constant, isolating charge selection as the only changing variable.
These results are consistent with how perforation friction drives cluster distribution in limited-entry completions.
In this case study, the charges producing the lowest perforation friction also produced the lowest perforation efficiency and cluster uniformity.
Side-by-Side Configuration Results
In a controlled charge comparison where all other perforating system variables were held constant (gun, string configuration, and orientation), a consistent relationship appears between hole size deviation and stimulation performance.
Charges B and C deviated the most above their specified perforation diameter, producing holes larger than expected. Those same charges showed lower initial perforation friction and weaker limited-entry behavior, which corresponded with the lowest perforation efficiency and cluster uniformity in the dataset.
Charges F, G, J, and K tracked closer to their specified perforation diameter and delivered noticeably stronger perf efficiency and UI performance.
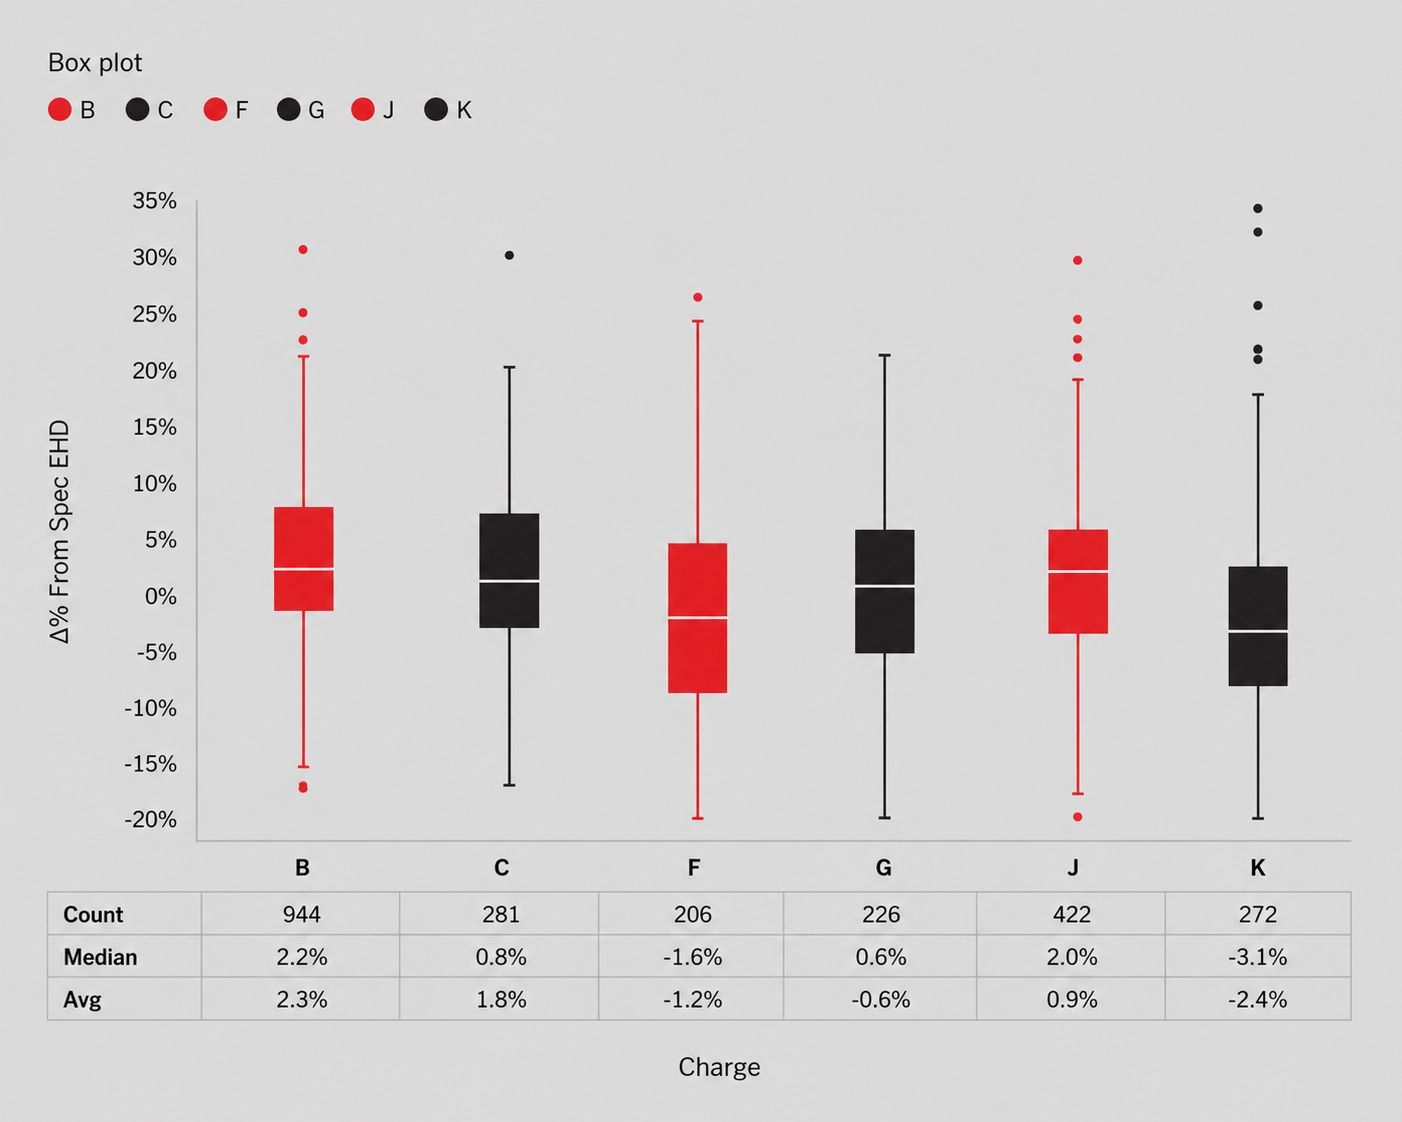
Charges B and C averaged only 63% and 56% perforation efficiency, with corresponding UI values of 0.68 and 0.61 – the lowest across all charges evaluated.
By comparison, charge F delivered 77% perforation efficiency and a UI of 0.84, indicating significantly stronger cluster contribution and stage distribution.
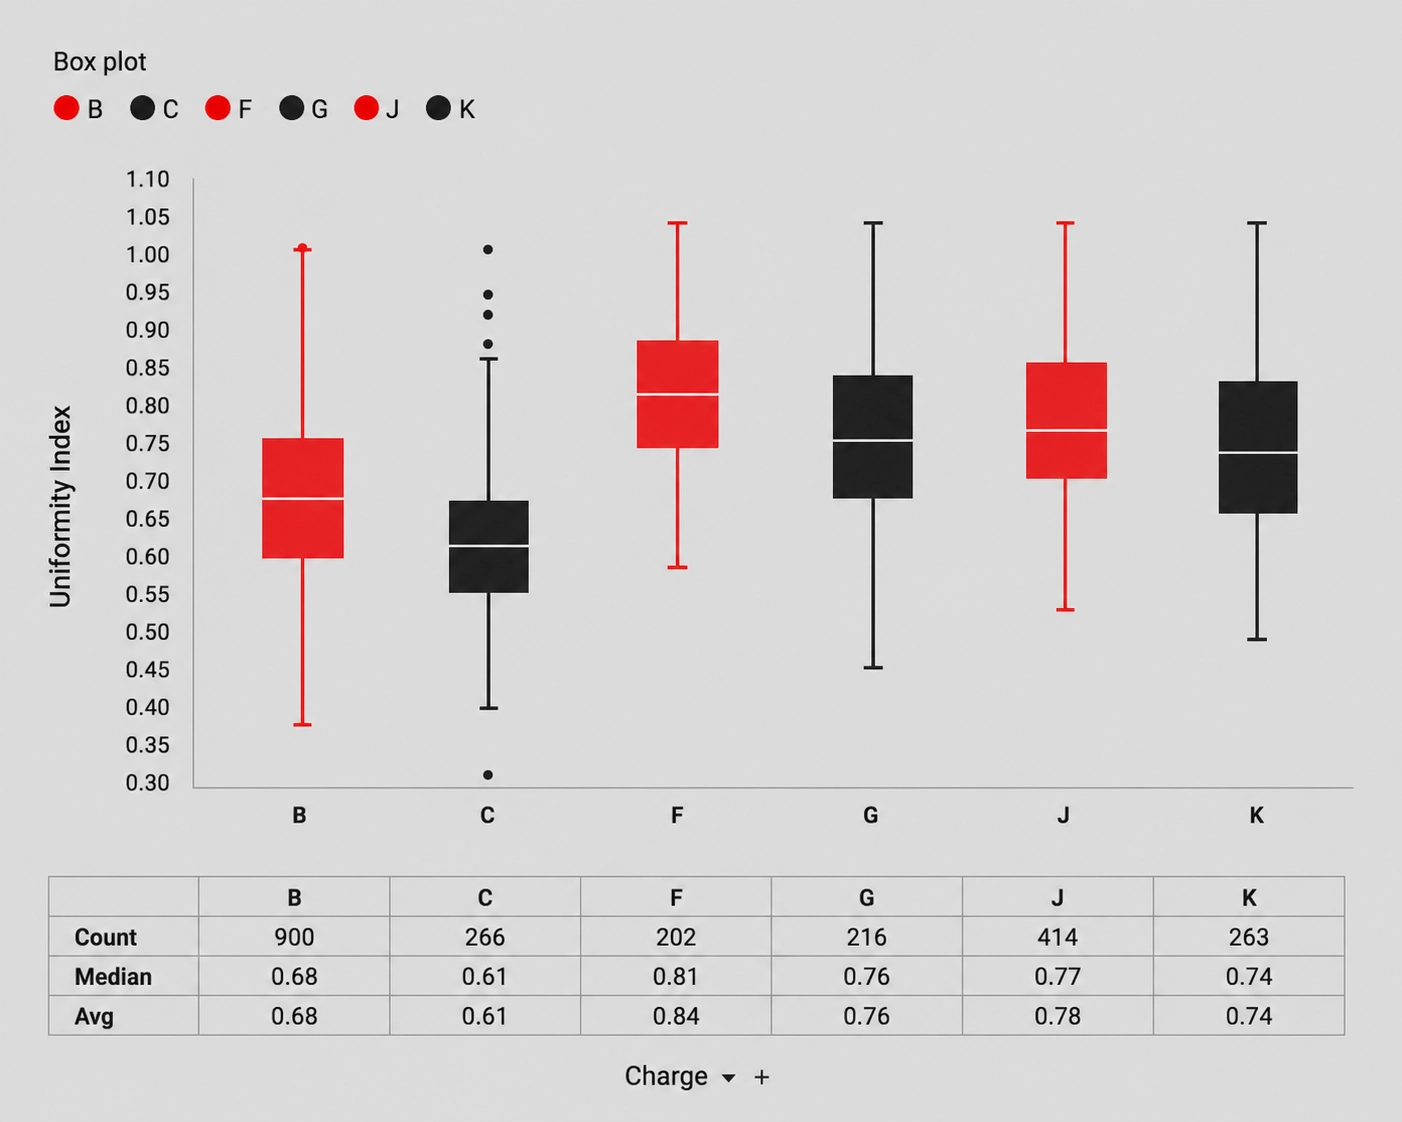
• Charges B and C showed the largest positive deviation from specified EHD (+2.3% and +1.8%).
• Those same charges produced the lowest perforation efficiency and cluster uniformity in the dataset.
• Charges that tracked closer to their specified EHD delivered stronger PE and UI outcomes, indicating more effective cluster contribution.
The Impact Is Clear
The impact is clear, field studies show that a 10% increase in Uniformity Index correlates with 7–12% more production in the Williston Basin and 6–10% in the Permian.
Optimizing perforating charges to improve perforation efficiency and cluster uniformity can translate directly into measurable production gains across the well.
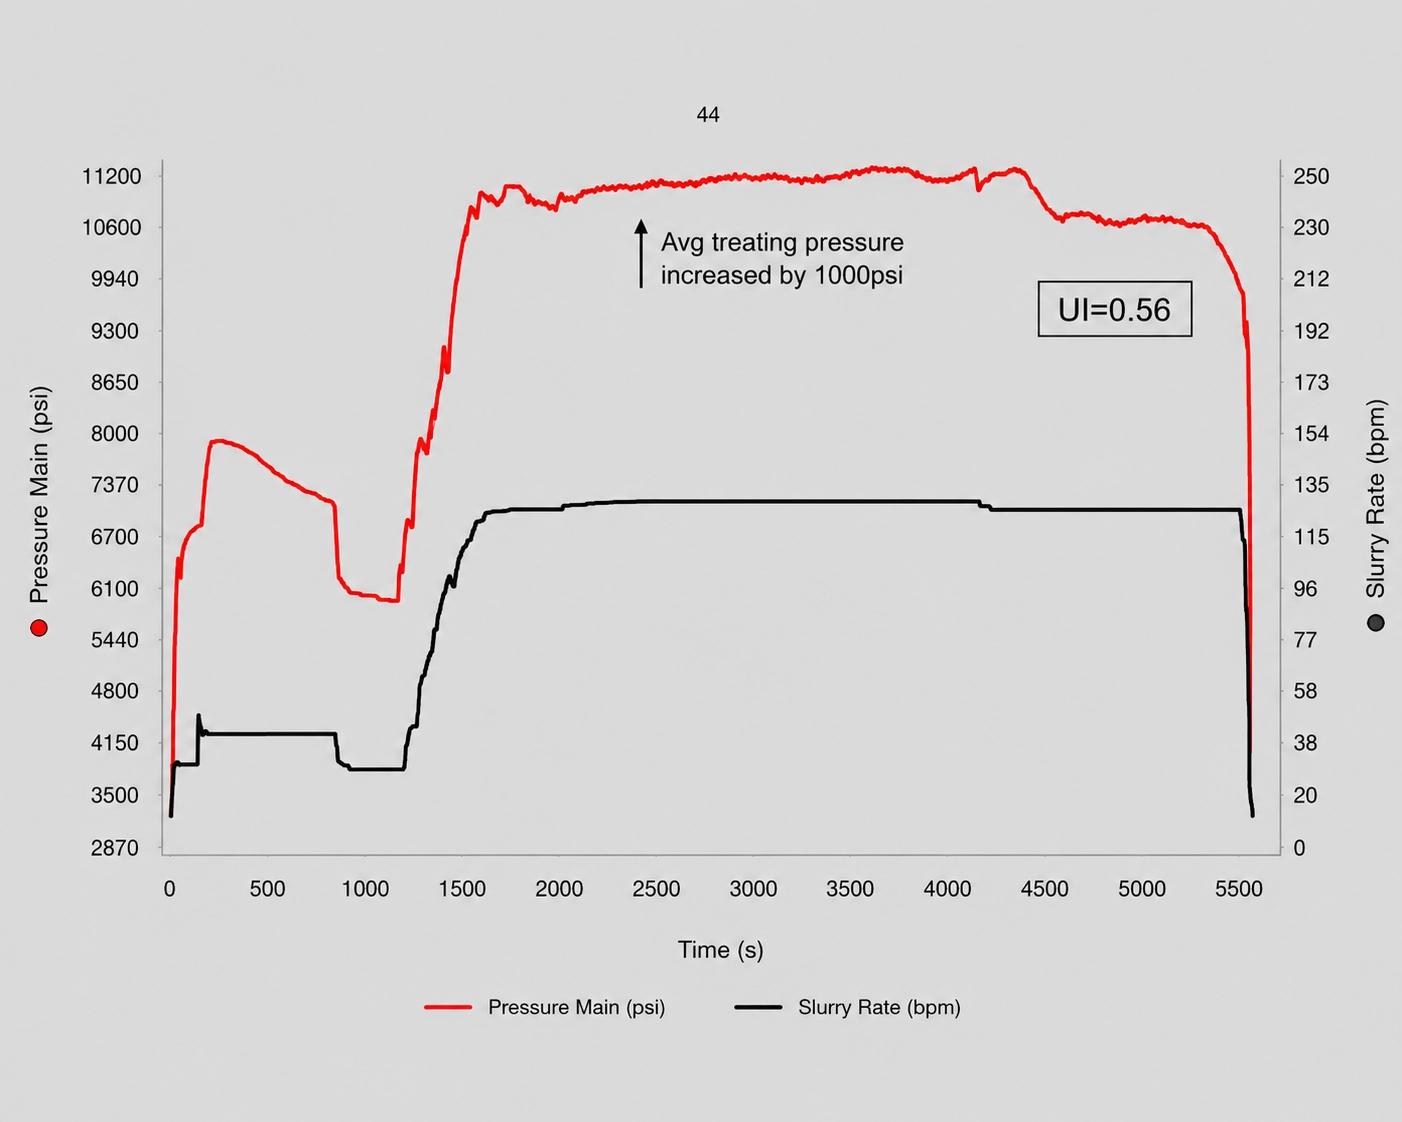
Additionally, if poor perforating charge selection results in only 75% of perforations effectively contributing to stimulation, roughly 25% of the completion investment is not generating productive fracture volume.
On a $10MM AFE well, that means up to $2.5MM of capital may be deployed without effectively stimulating rock.
Together, these results highlight how charge selection alone can influence stage efficiency and distribution.
Actionable Next Steps for Program-Level Optimization
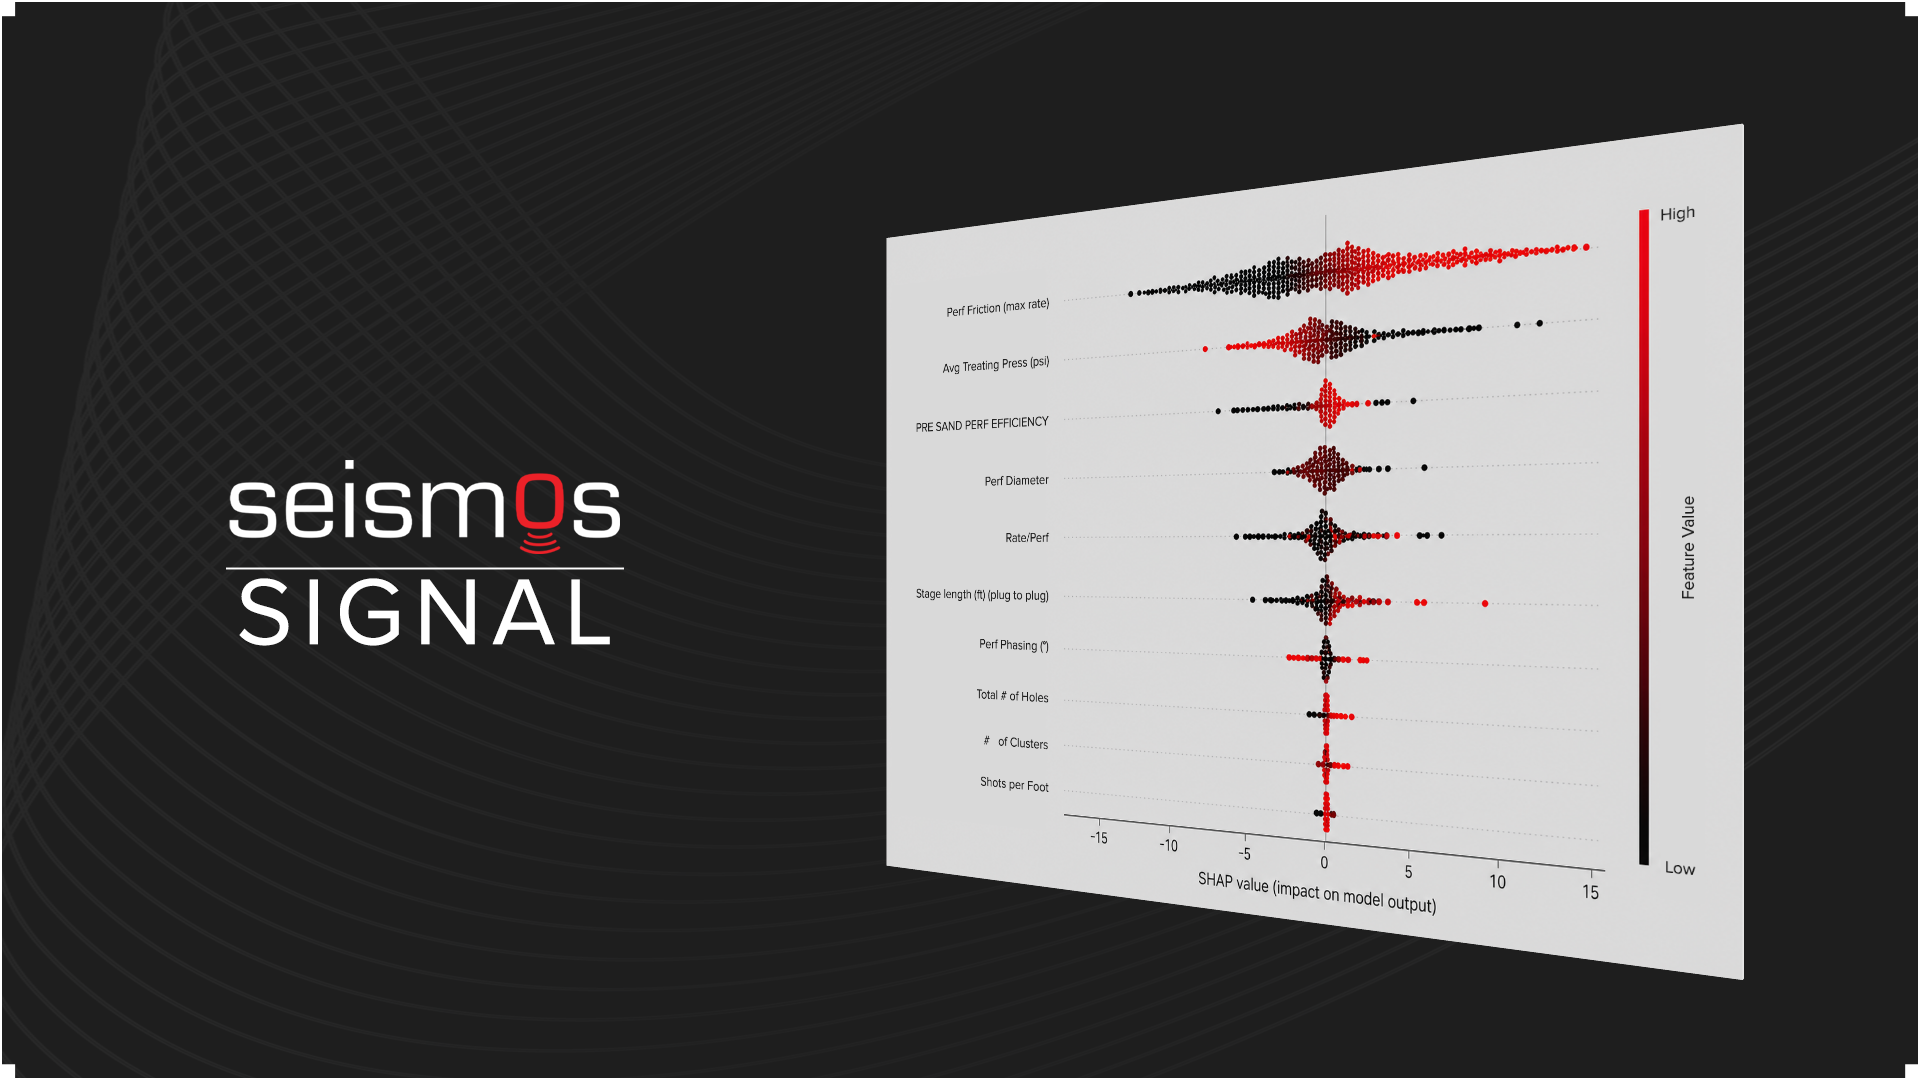
Using measured downhole behavior, this analysis compares charge performance based on perforation efficiency and Uniformity Index rather than nominal charge specifications.
• Use measured perforation efficiency and UI to benchmark charge performance within the same completion design.
• Evaluate charges by how closely actual hole size tracks with designed.
• Standardize the charge designs that deliver the most consistent perforation efficiency and cluster uniformity across wells.