How SAFA Replaces Erroneous EHD Assumptions to Unlock Superior Frac Stage Performance
Why Initial Flow Area Matters
UI measures how evenly fluid is distributed across clusters, with 1.0 indicating perfect uniformity.
SAFA uses the percentage of open perfs and combines this with slurry pumped over time to derive a volume per cluster, which is used to calculate UI.
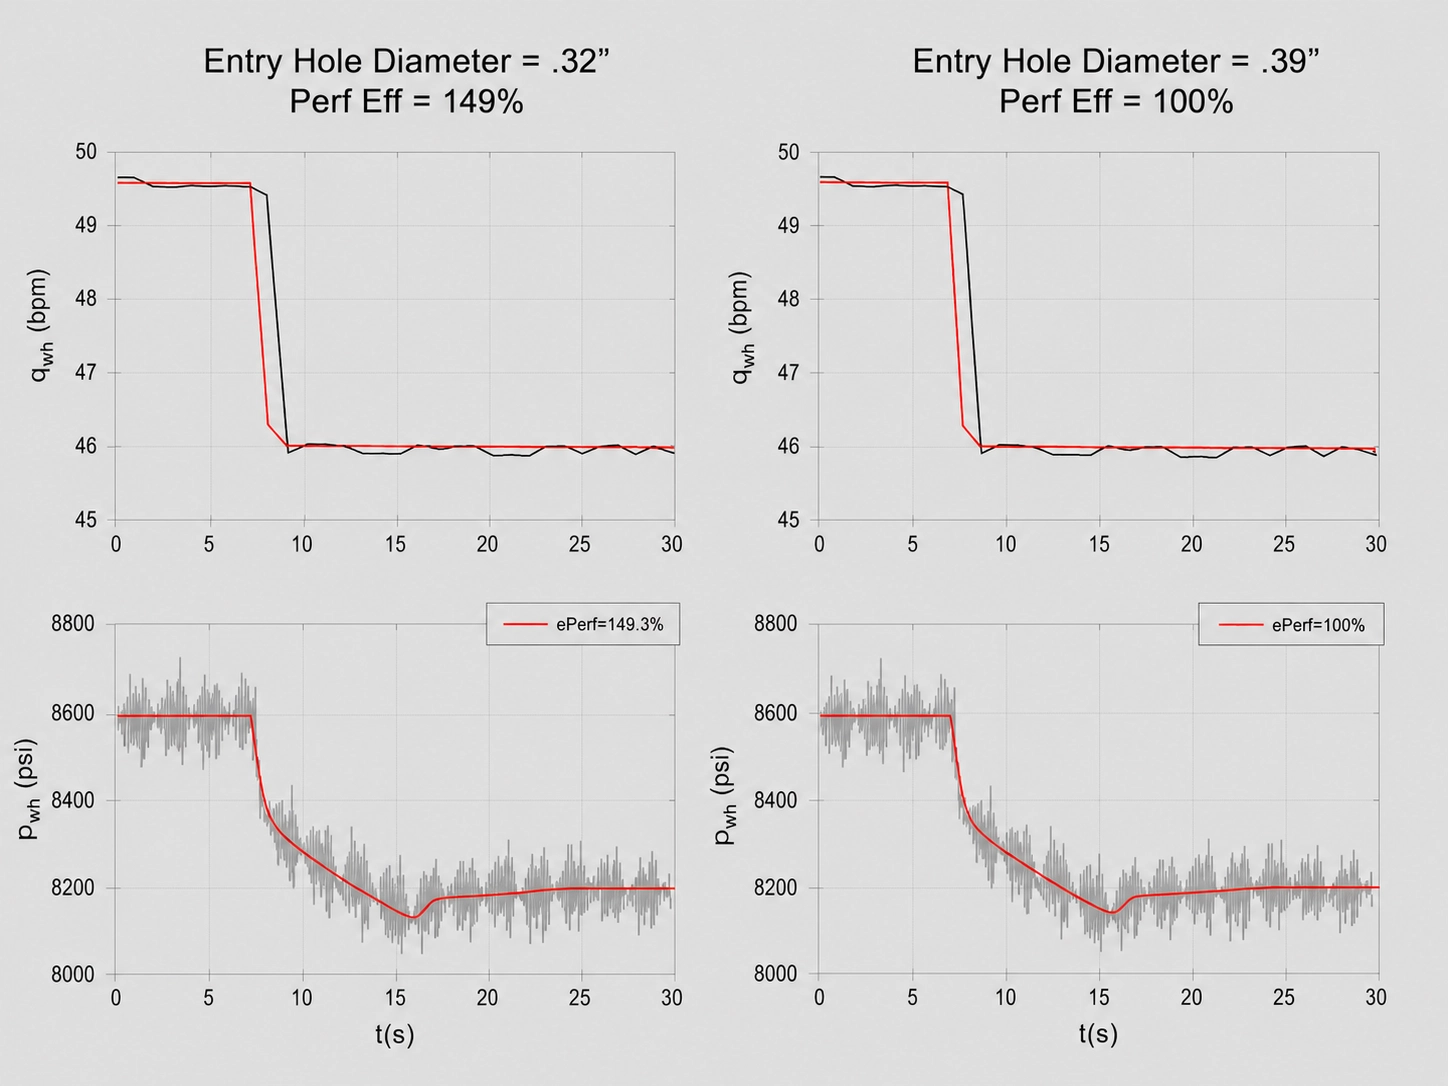
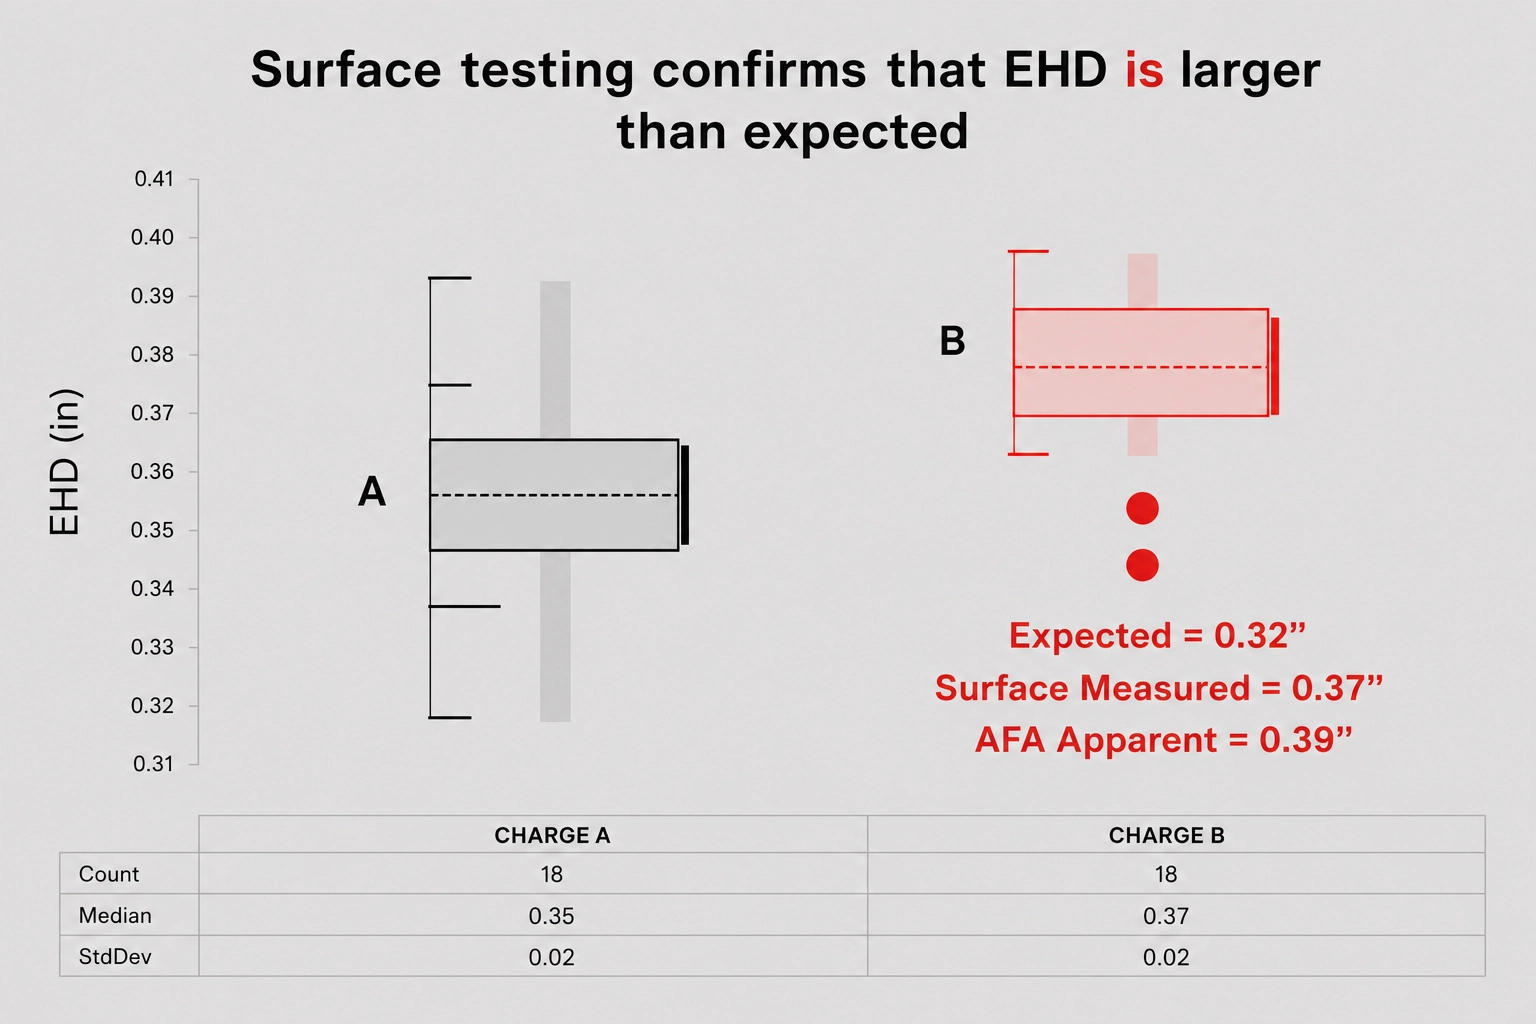
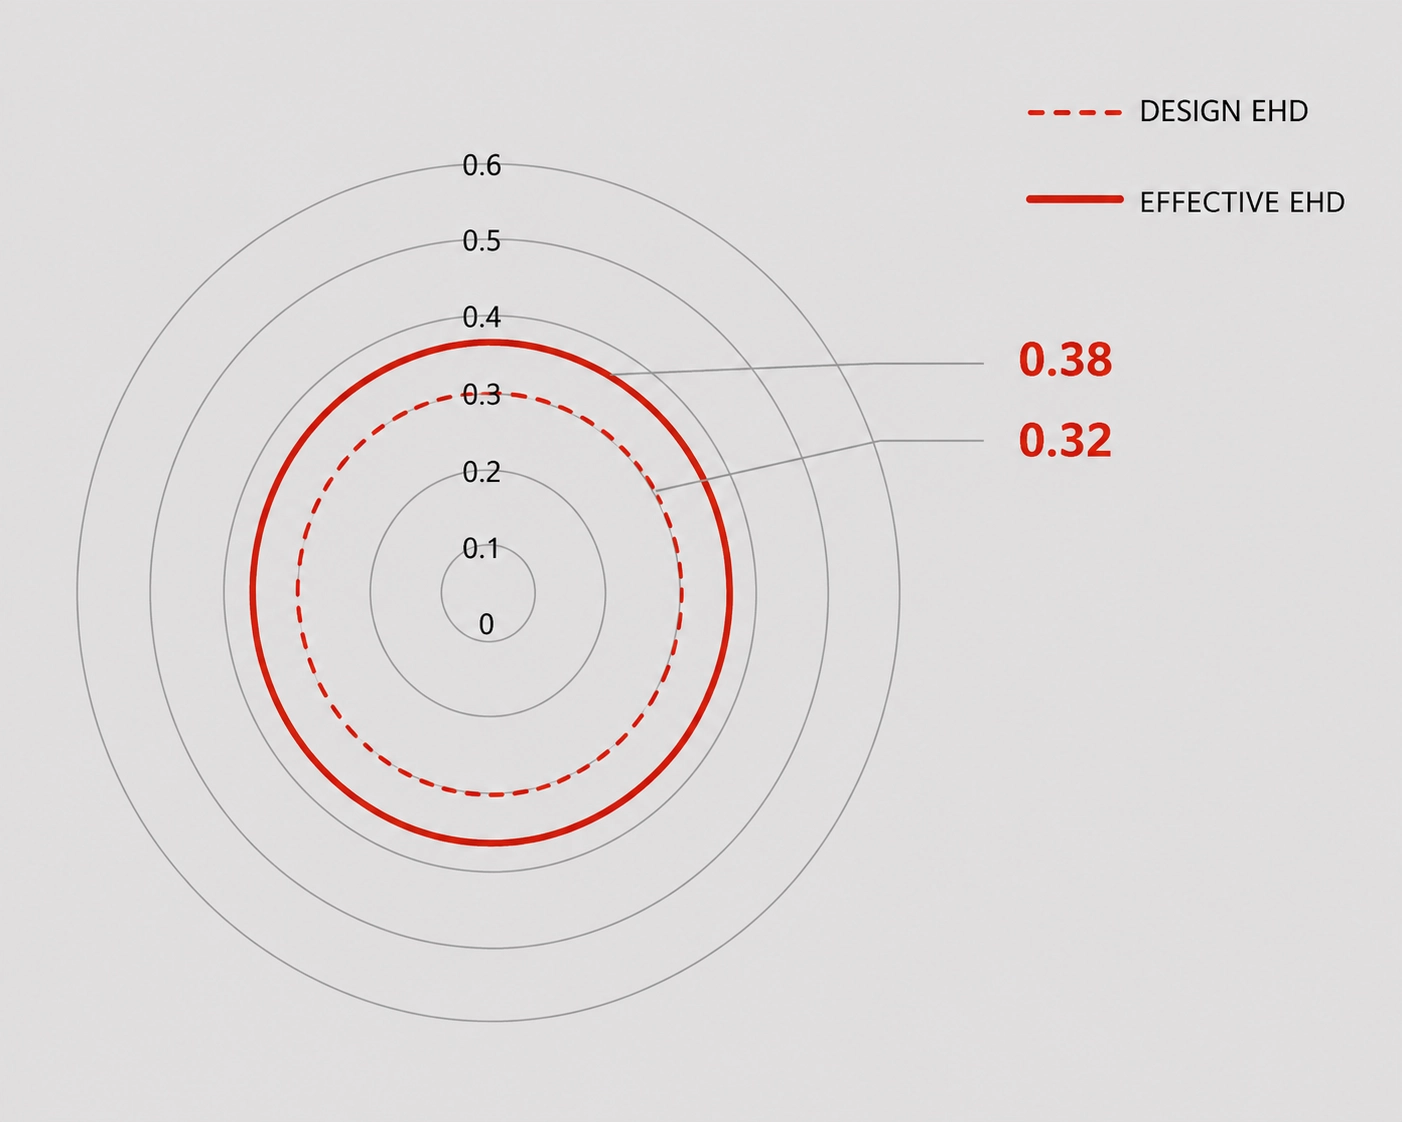
At the start of a stage, with all perforations open, perf efficiency should be ~100%. Yet SAFA deployments have measured initial efficiencies of 140–150% – clearly indicating that the hole diameter provided by the shaped charge manufacturer was inaccurate.
How SAFA Derives EHD from Acoustic Signatures
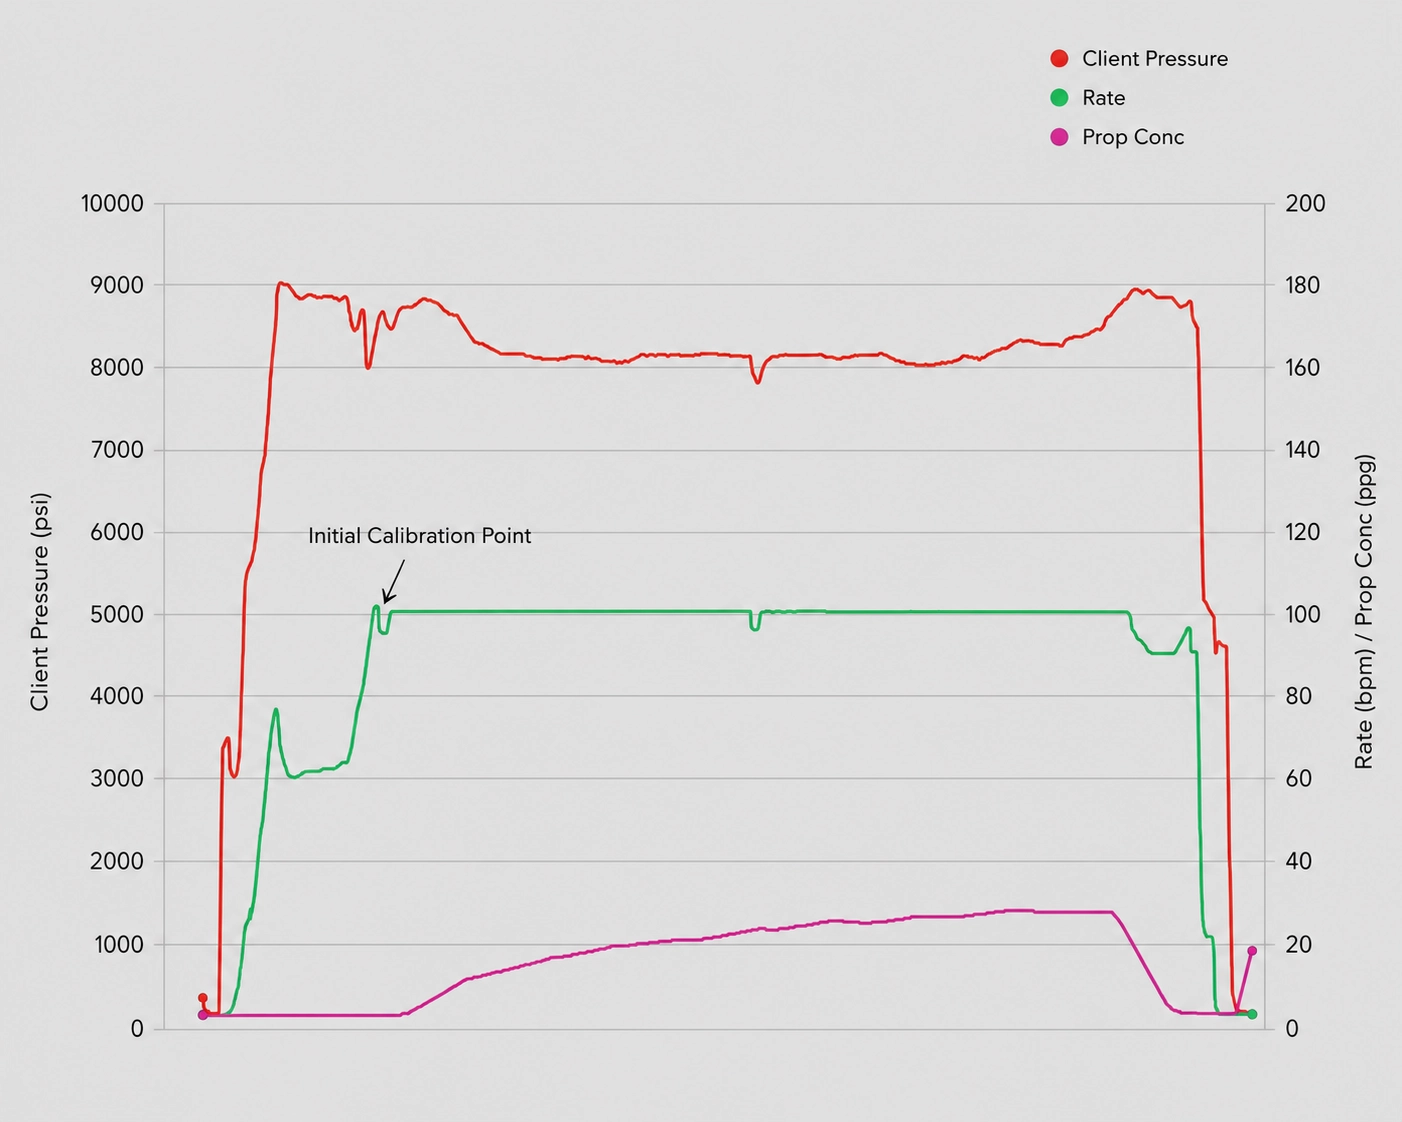
During each stage, SAFA uses a brief slurry rate reduction (of a few barrels per minute) to create a pressure pulse. High-frequency pressure gauges at the wellhead record this oscillatory signal as it propagates through the wellbore.
From this response, perforation friction is directly measured, which corresponds directly to the total open flow area.
If all perforations are of the designed diameter and open with pressure and rate requirements being met, the measured friction should match the expected limited-entry pressure drop for the planned perf design. Any deviation indicates the actual perforation diameters differ from plan, allowing engineers to back-calculate the true initial EHD.
Field Validation of the Approach
The first example shown below compares a surface perforation test (~0.37" EHD) matching the EHD calculated from SAFA data when shooting a new charge type (B).
The second example compares downhole imaging data gathered after fracturing to the EHDs calculated using SAFA data, which were within ~3% of the camera-measured diameters.
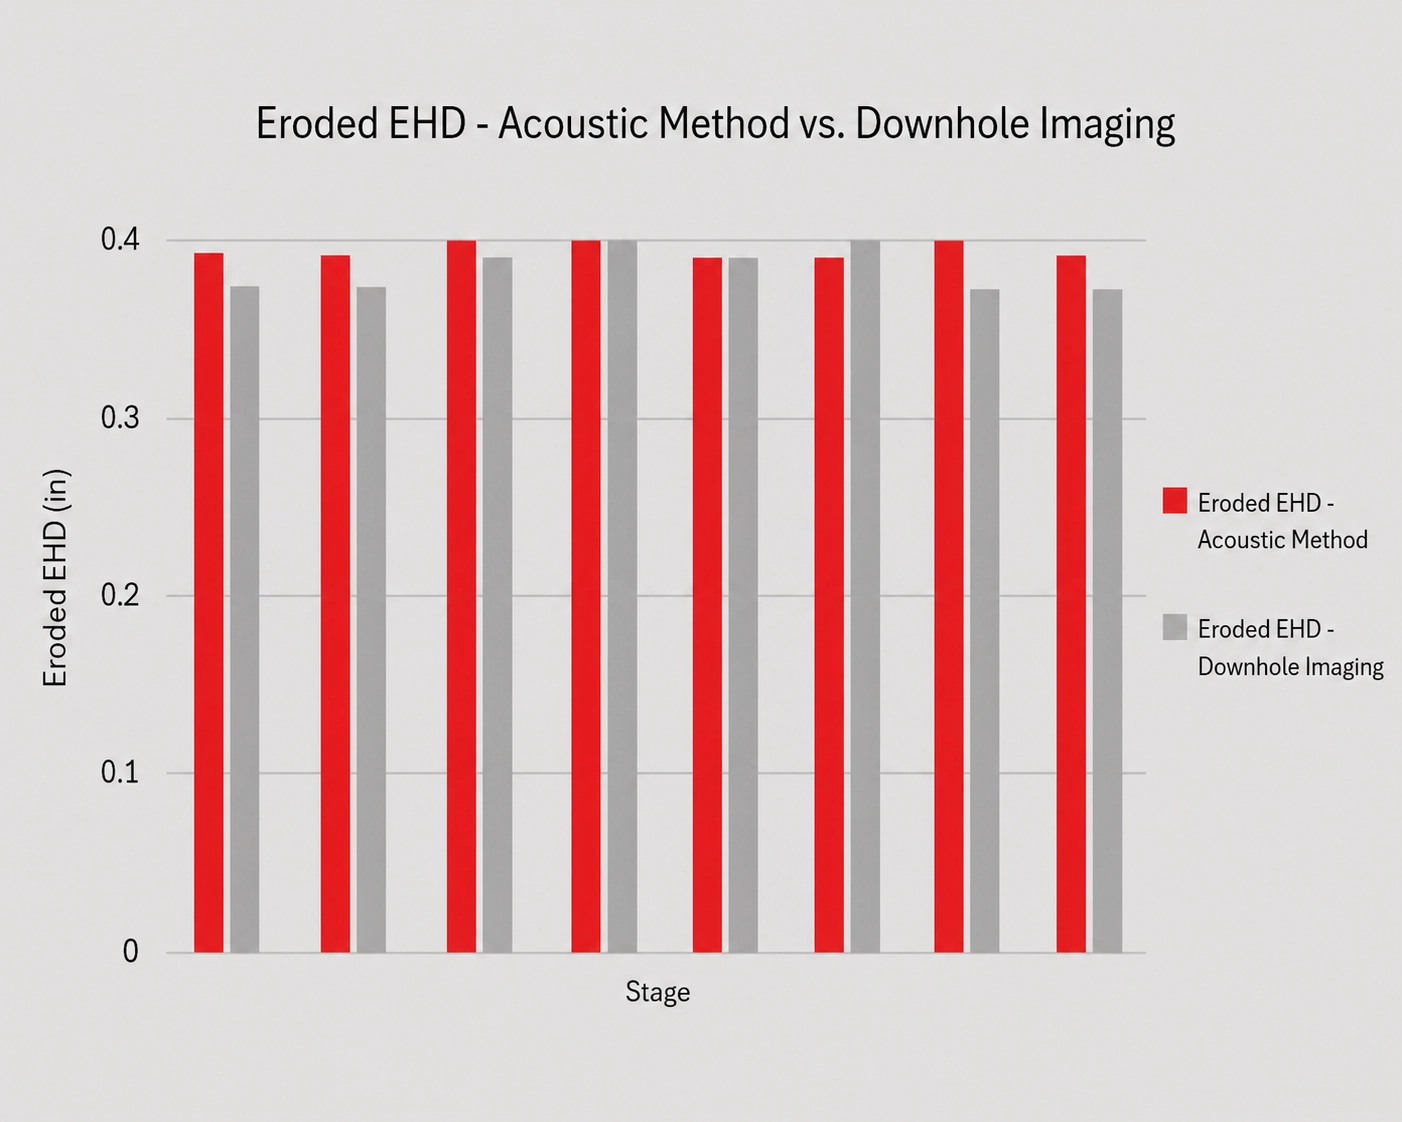
These validations demonstrate strong agreement between SAFA-derived initial flow areas and the true perforation size, lending credibility to the perf efficiency and UI results.
Furthermore, field studies have shown that acoustic UI trends closely mirror fiber-optic sensor data (R² ~0.92), so operators can trust the more accessible SAFA approach.
The Economic Cost of Getting UI Wrong
Even small increases in perforation diameter can sharply reduce friction due to the D⁴ relationship between diameter and flow rate. If holes are larger than expected, friction drops below limited entry targets – causing early cluster dominance, lower Uniformity Index (UI), and reduced stimulated rock volume.
The impact is real: a 10% UI increase correlates with 7-12% more production in the Williston Basin and 6-10% in the Permian Basin. Operators also estimate a 0.1 UI gain can add ~$300K in NPV per well. Measuring actual perforation sizes with SAFA isn’t just smart, it protects well economics.
- Widespread, Low-Cost Deployment: Unlike fiber optic sensors or downhole imaging – which are typically only used on a few pilot wells – SAFA can be used on every well. The only requirement is a fast-sampling pressure sensor at surface – no downhole tools or procedure changes. This makes program-wide frac QC feasible.
- Quantifiable Economic Impact: A calibrated start protects stage economics – field data show that every 10% UI improvement delivers 6–12% more production.