TECHNICAL BRIEF - ISSUE #2
How SAFA (Seismos Acoustic Friction Analysis) Replaces Erroneous EHD Assumptions to Unlock Superior Frac Stage Performance
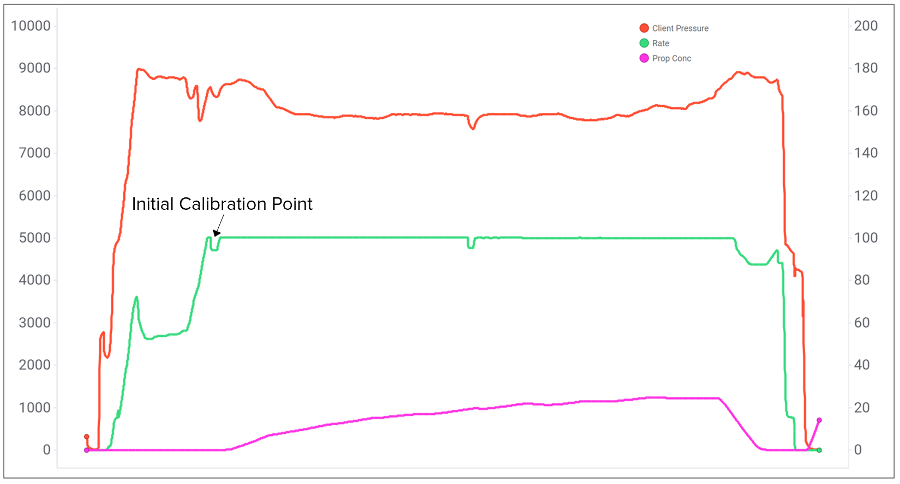
Understanding the initial flow area for a stage is make-or-break for stage performance.
Perforating system spec sheets rarely reflect the actual downhole hole size. Even small inaccuracies propagate into significant errors in perforation efficiency and Uniformity Index (UI). SAFA data consistently show that real-time calibration of effective hydraulic diameter (EHD) is required to quality control, eliminate assumptions, and provide accurate, actionable insight into cluster behavior.
Key insights from field deployments::
- Accurate measurement of initial perforation flow area sets the baseline for cluster efficiency and UI calculations. Any error in the initial EHD input will carry through the stage’s analysis, skewing every further measurement.
- Holes that are even slightly larger than expected drastically reduce perf friction, causing early cluster dominance, lower UI, and lost SRV.
- Surface tests and downhole imaging both confirm the Seismos acoustically derived EHDs match actual perforation sizes within ~3%. With the correct initial flow area, SAFA accurately captures cluster behavior without costly fiber optic sensors or downhole cameras.
- Upon calibration, SAFA becomes a trusted real-time monitoring & quality control system, using only surface pressure data to catch issues like excessive perf erosion, plug issues, or casing leaks and enable on-the-fly adjustments.
Why Initial Flow Area Matters
UI measures how evenly fluid is distributed across clusters, with 1.0 indicating perfect uniformity.
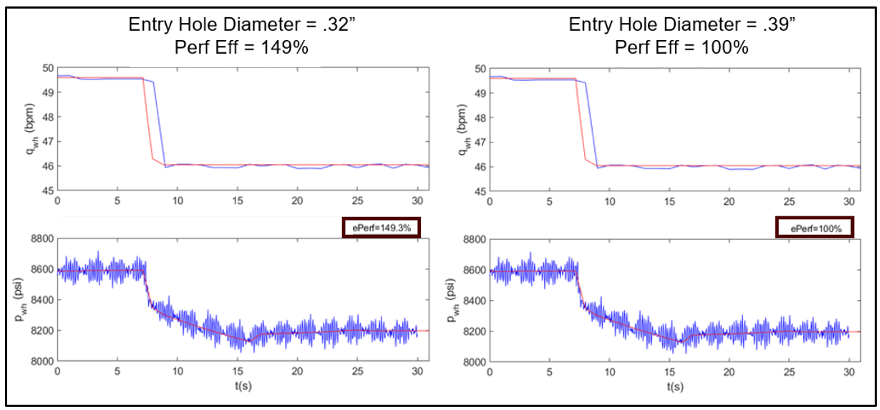
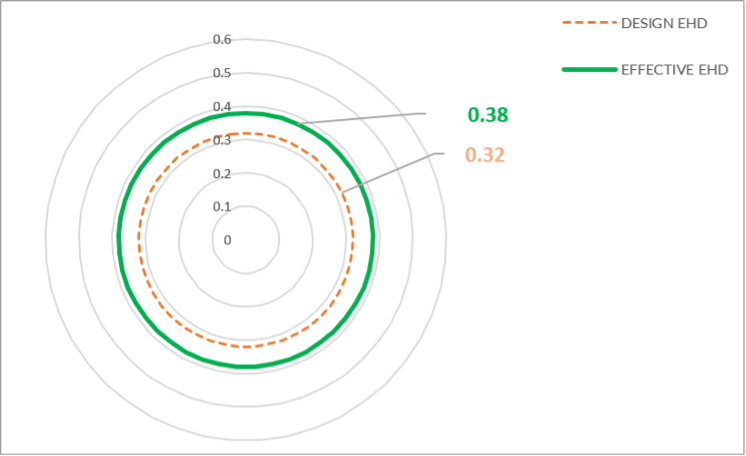
At the start of a stage, with all perforations open, perf efficiency should be ~100%. Yet SAFA measurements often indicate initial efficiencies of 140–150% - revealing that the hole diameter provided by the shaped charge manufacturer was inaccurate.
Using the discrepancy between expected and measured perf efficiency, along with the corresponding perf friction response, SAFA solves for the effective hydraulic diameter that represents the true open flow area.
Field Validation of the Approach
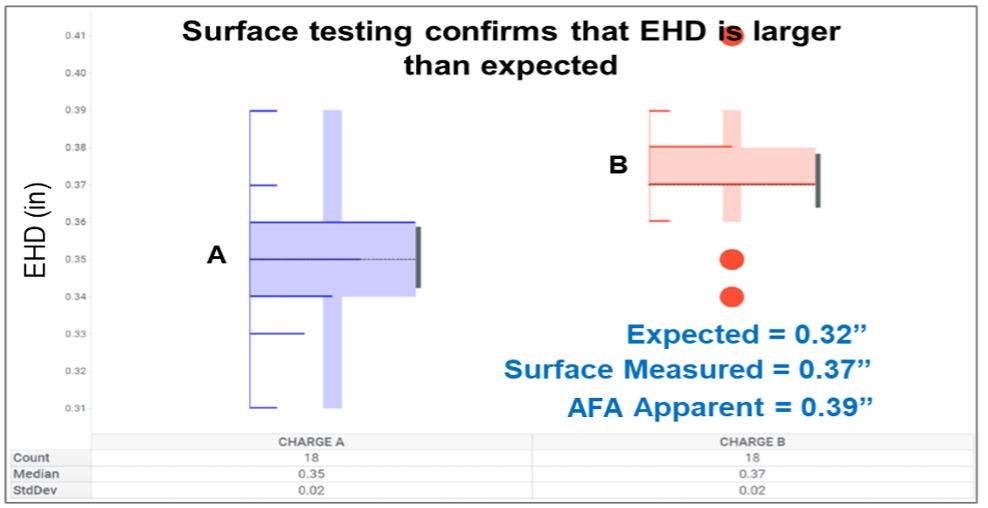
The first example shown below compares a surface perforation test (~0.37" EHD) matching the EHD calculated from SAFA data when shooting a new charge type (B).
The second example compares downhole imaging data gathered after fracturing to the EHDs calculated using SAFA data, which were within ~3% of the camera-measured diameters.
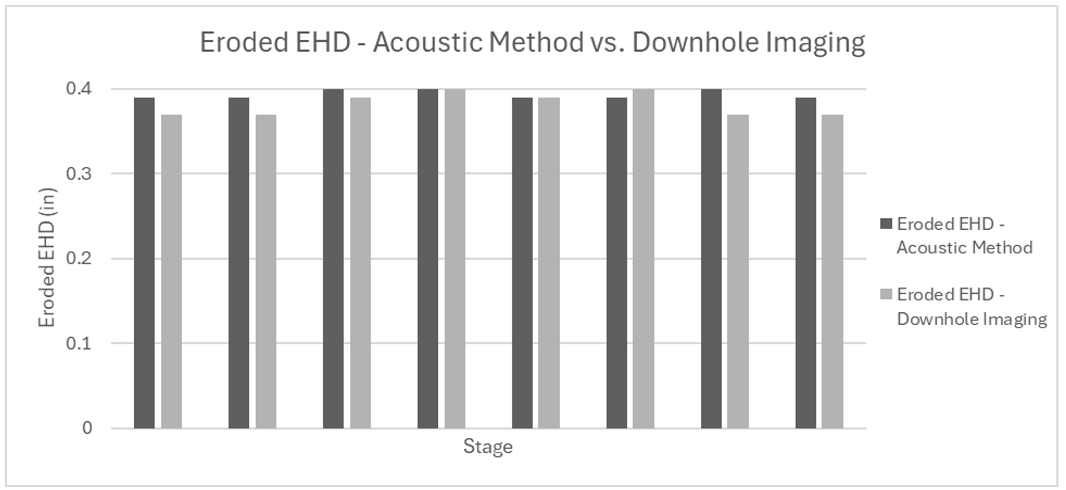
These validations demonstrate strong agreement between SAFA-derived initial flow areas and the true perforation size, lending credibility to the perf efficiency and UI results. Furthermore, field studies have shown that acoustic UI trends closely mirror fiber-optic sensor data (R² ~0.92), so operators can trust the more accessible SAFA approach.
The Economic Cost of Getting UI Wrong
Even small increases in perforation diameter can sharply reduce friction due to the D⁴ relationship between diameter and flow rate. If holes are larger than expected, friction drops below limited entry targets – causing early cluster dominance, lower Uniformity Index (UI), and reduced stimulated rock volume.
The impact is real: a 10% UI increase correlates with 7-12% more production in the Williston Basin and 6-10% in the Permian Basin. Operators also estimate a 0.1 UI gain can add ~$300K in NPV per well. Measuring actual perforation sizes with SAFA isn’t just smart, it protects well economics.
Engineering Benefits of a Calibrated Start
- Verified Evaluation: With the model anchored, calculated perforation efficiencies and UIs reflect actual downhole conditions instead of input errors.
- Early Anomaly Detection: A correct baseline makes it easier to spot unexpected behavior. If a cluster’s UI suddenly drops or surges, it may signal excessive perf erosion, a blockage, or a plug or casing failure.
- Real-Time Optimization: Since SAFA runs on high-speed surface pressure data and small rate changes, every stage can be monitored live. If the calibrated UI indicates poor cluster distribution or exhibits a sudden change, pumping adjustments can be made on the fly.
- Widespread, Low-Cost Deployment: Unlike fiber optic sensors or downhole imaging – which are typically only used on a few pilot wells – SAFA can be used on every well. The only requirement is a fast-sampling pressure sensor at surface – no downhole tools or procedure changes. This makes program-wide frac QC feasible.
- Quantifiable Economic Impact: A calibrated start protects stage economics – field data show that every 10% UI improvement delivers 6–12% more production.
Ready to Apply Calibrated Flow Area Data on Your Wells?
Sign up for a technical session and learn how to apply SAFA in your program. Our team will explain how you can:
- Compare your perforation designs to actual EHD measurements.
- Run SAFA on your stages to calibrate total open flow area.
- Interpret the cluster data to find perf inefficiencies or isolation leaks.
- Implement real-time monitoring so you can optimize on the fly without fiber or special tools.
Or, schedule a technical review of your wells and see how initial flow area calibration with SAFA can improve your frac outcomes.